OtterCTF dates from December 2018 and includes reverse engineering, steganography, network traffic, and more traditional forensics challenges. This write-up covers the network forensics portion. I have previously written-up the memory forensics section, and the Birdman’s Data network challenge. The whole CTF is available to play as of the publication of this post.
I managed to complete three of the four challenges in the network traffic section of the CTF. This post is a write-up of the Look At Me challenge.


We start by downloading the challenge PCAP and calculating hashes for reference.
MD5: d7dbb2394596594b438ab3110ace3408
SHA1: fc16f0636a7f141b8b17e0e7a38b776dd5c21c82

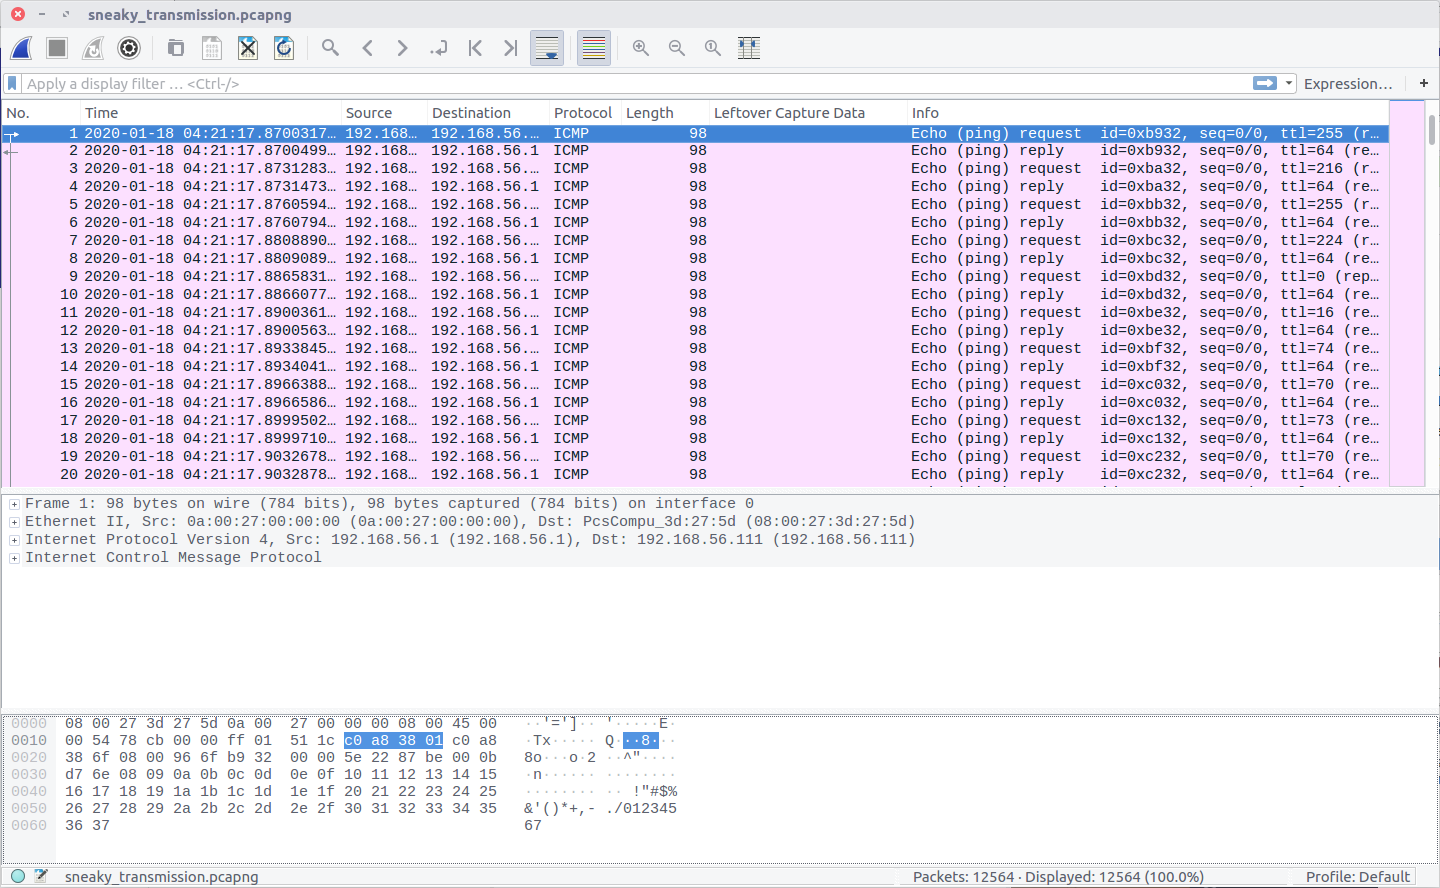
Opening up the PCAP in Wireshark, the first thing is that we are not working with TCP/IP traffic; instead this appears to be USB data from a Wacom CTL-471 drawing tablet. After some Google searching I found a write-up of a 2017 BITSCTF challenge featuring USB traffic from a Wacom CTL-460 tablet, which was a huge help in solving this challenge.
With the help of The Blog Post I realised that the packets containing the Leftover Capture Data we need could be filtered within Wireshark based on the Frame Length…
((usb.transfer_type == 0x01) && (frame.len == 37))

Then extract to a separate PCAP with tshark for further processing.
tshark -r look_at_me.pcap -w filtered.pcap -Y '((usb.transfer_type == 0x01) && (frame.len == 37))'

The data we need is a representation of the X/Y coordinates of the pen on the drawing tablet, and the Z value representing the pressure of the pen. Using the packet in the screenshot above as an example:
02:f0:82:0a:ba:05:00:08:00

02:f0 - Header
82:0a - X
ba:05 - Y
00:08 - Z (Pressure)
00    - Padding?
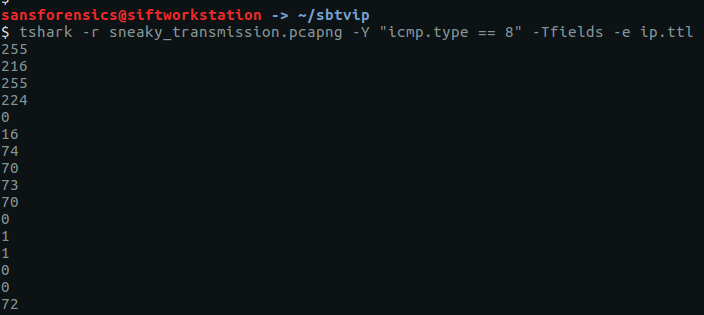
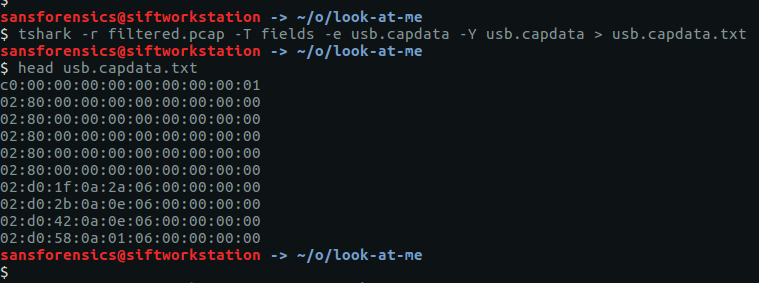
This data is contained within the usb.capdata field; we can use tshark again to extract this to a text file and discard the rest of the PCAP.
tshark -r filtered.pcap -T fields -e usb.capdata -Y usb.capdata > usb.capdata.txt
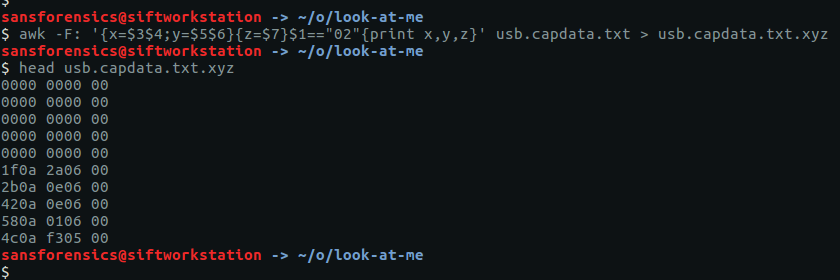
The next thing to do was to use awk (shamelessly lifted from The Blog Post) to convert these raw hex values to little-endian X/Y and Z coordinates.
awk -F: '{x=$3$4;y=$5$6}{z=$7}$1=="02"{print x,y,z}' usb.capdata.txt > usb.capdata.txt.xyz
After installing the pwntools Python library and running a small Python script “inspired” by The Blog Post, we have the coordinates in a format suitable to be plotted as an image using Gnuplot.
#!/usr/bin/python
from pwn import *

for line in open('usb.capdata.txt.xyz').readlines():
  coord = line.strip().split(' ')
  x = int(coord[0],16)
  y = int(coord[1],16)
  z = int(coord[2],16)

  if z > 0:
    print u16(struct.pack(">H",x)),u16(struct.pack(">H",y))

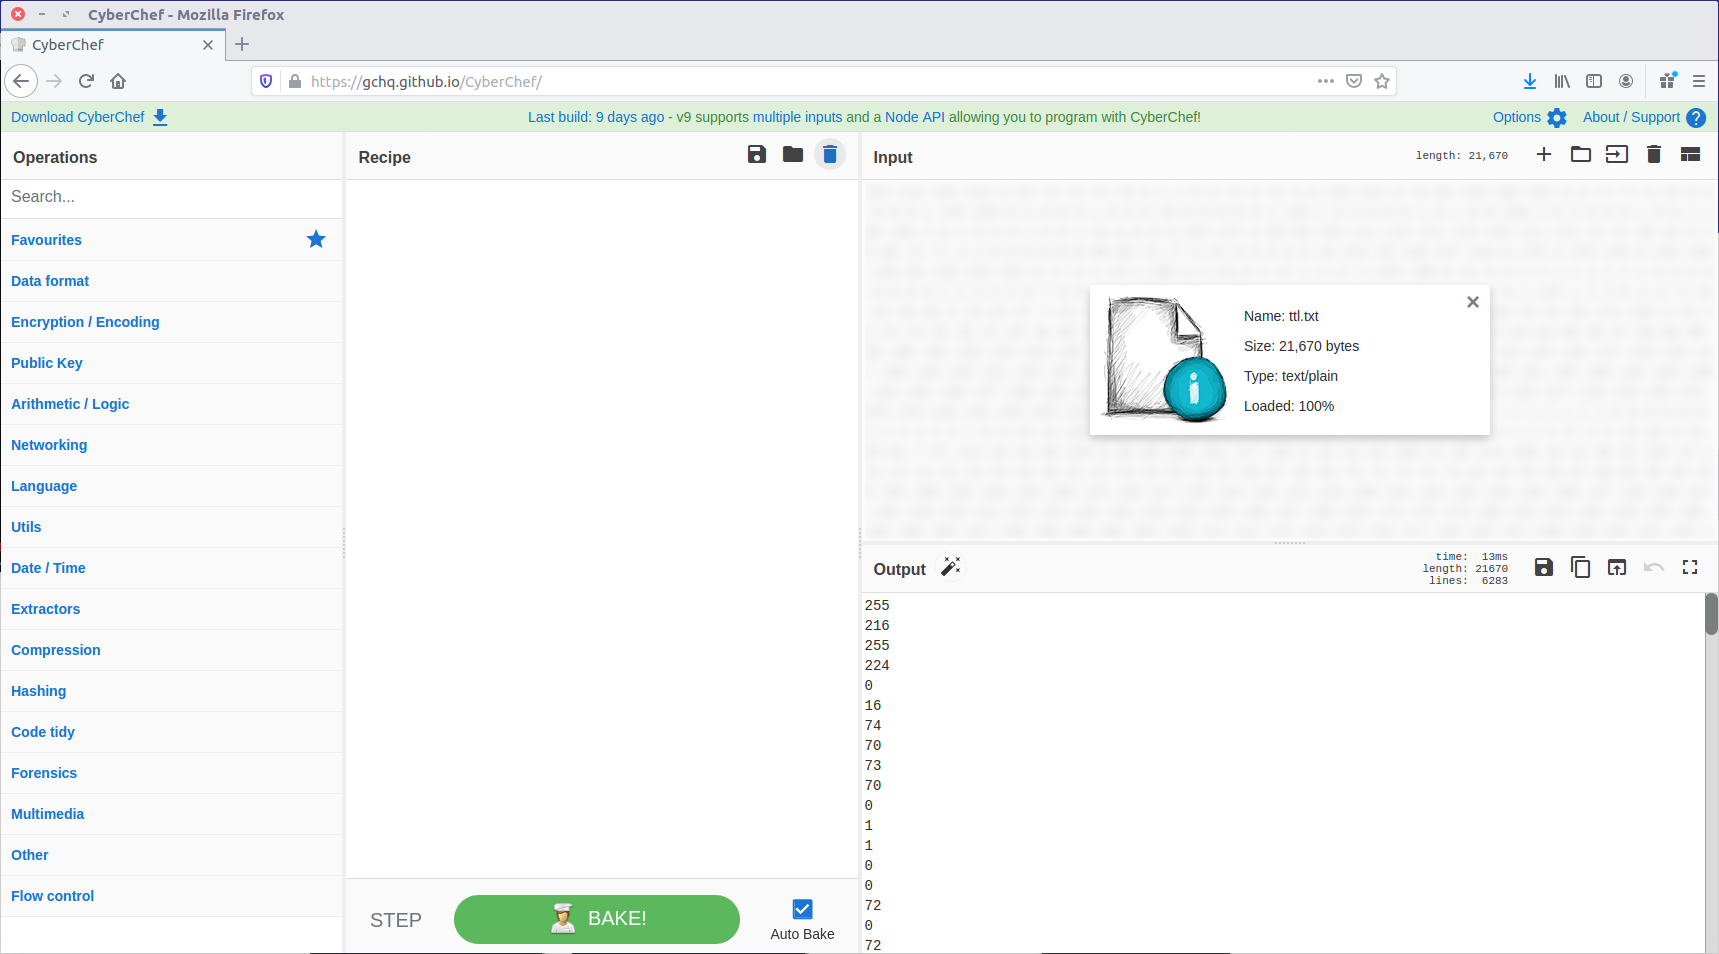
We feed our newly converted coordinates into Gnuplot…

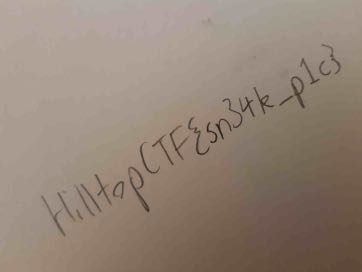
And out pops an image!

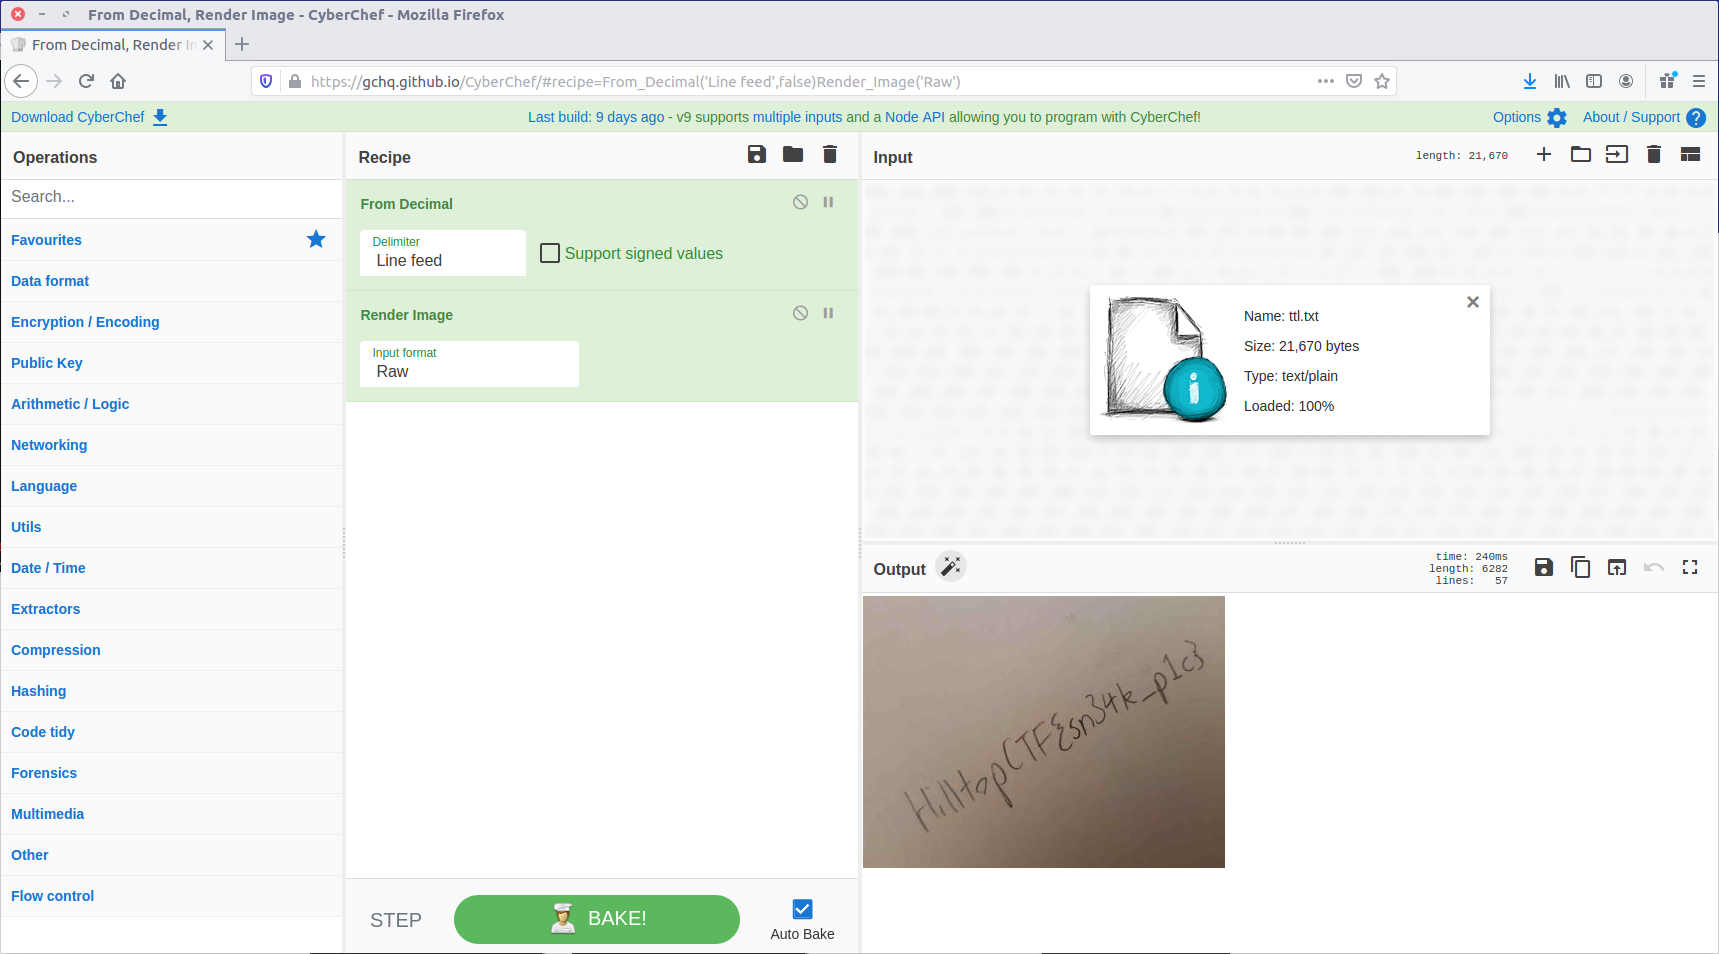
After exporting to a PNG file, we can flip it for easier reading.
convert -flip flag.png flag-flipped.png

There we go! Submit the flag and claim the points, thanks in large part to The Blog Post.
CTF{0TR_U58}
Next up in my OtterCTF series, Otter Leak.