Magnet Weekly CTF – Week 12

The Magnet Forensics Weekly CTF has been running since October and sets one question each week using an image that changes each month. The October questions were based on an Android filesystem dump, and November’s related to a compromised Hadoop cluster built on Ubuntu Linux. The December challenges return to more familiar territory for me – Windows memory analysis!

These questions use the memory image from the Magnet Virtual Summit 2020, which I first examined during the MVS CTF earlier this year. You can find the rest of my Magnet Weekly CTF write-ups here.

We have reached the final challenge of the #MagnetWeeklyCTF and this week the questions were set by Tarah Melton.

Part 1 (30 points)

What is the PID of the application where you might learn “how hackers hack, and how to stop them”?

Format: #### Warning: Only 1 attempt allowed!

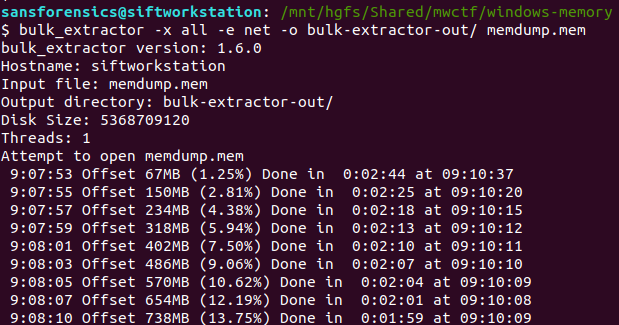
Ok, we are trying to link a particular string to a Process ID. I started by extracting the strings from the entire memory image then using a case-insensitive grep search to get a better idea of what we might be looking for.

strings memdump.mem | grep -i "how hackers hack, and how to stop them"

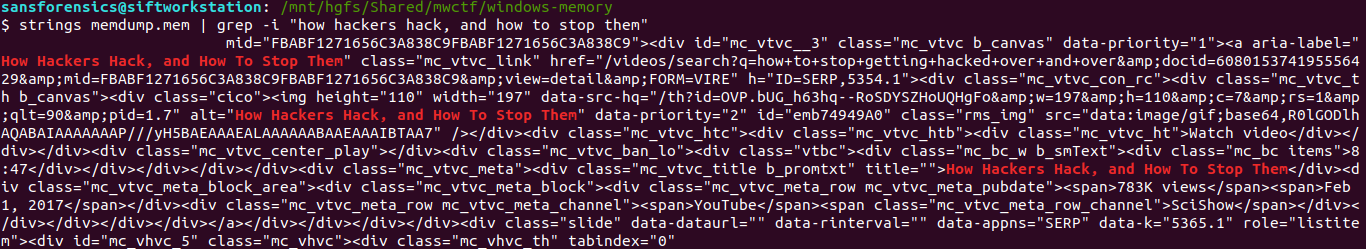
The text surrounding the match looks like HTML so any of the Internet Explorer or Chrome browser processes are likely candidates, but given the number of them I don’t want to dump each process memory and search manually. Instead, now that we know exactly what to look for, we can throw the yarascan plugin at the image and check the Process ID associated with the matching section of memory. Easy.

vol.py -f memdump.mem --profile=Win7SP1x64 yarascan -Y "How Hackers Hack, and How To Stop Them"

Ok, not a great start. Volatility as installed on the pre-built Ubuntu 18.04 SANS SIFT VM throws an exception because of conflicting use of the -C option in the malfind plugin:

Volatility Foundation Volatility Framework 2.6.1
Traceback (most recent call last):
File "/usr/local/bin/vol.py", line 192, in <module>
main()
File "/usr/local/bin/vol.py", line 174, in main
command = cmds[module](config)
File "/usr/local/lib/python2.7/dist-packages/volatility/plugins/malware/malfind.py", line 190, in __init__
help = 'Make the search case insensitive') 
File "/usr/local/lib/python2.7/dist-packages/volatility/conf.py", line 363, in add_option
self.optparser.add_option("-{0}".format(short_option), "--{0}".format(option), **args)
File "/usr/lib/python2.7/optparse.py", line 1021, in add_option
self._check_conflict(option)
File "/usr/lib/python2.7/optparse.py", line 996, in _check_conflict
option)
optparse.OptionConflictError: option -C/--case: conflicting option string(s): -C

Fixing the malfind and yarascan Volatility plugins on SIFT 18.04

Luckily I’m not the first person to run into this problem, and an issue submitted to the SIFT github repository contains a workaround:

Make a backup of the malfind.py source file, which in my SIFT VM was located:

/usr/local/lib/python2.7/dist-packages/volatility/plugins/malware/malfind.py

Then open the original file for editing and change the short_option at line 189. The original conflicting option is C (upper-case); I changed this to c (lower-case), as shown below:

config.add_option("CASE", short_option = 'c', default = False, action = 'store_true',

I also had to change the short_option at line 195. The original option Y (upper-case) caused another conflict, so I changed this to U (upper-case), as below:

config.add_option('YARA-RULES', short_option = 'U', default = None,

Now, with those minor changes in place, we can get back to the challenge. Using the modified yarascan plugin, we search for the correctly-capitalised version of the string.

vol.py -f memdump.mem --profile=Win7SP1x64 yarascan -U "How Hackers Hack, and How To Stop Them"

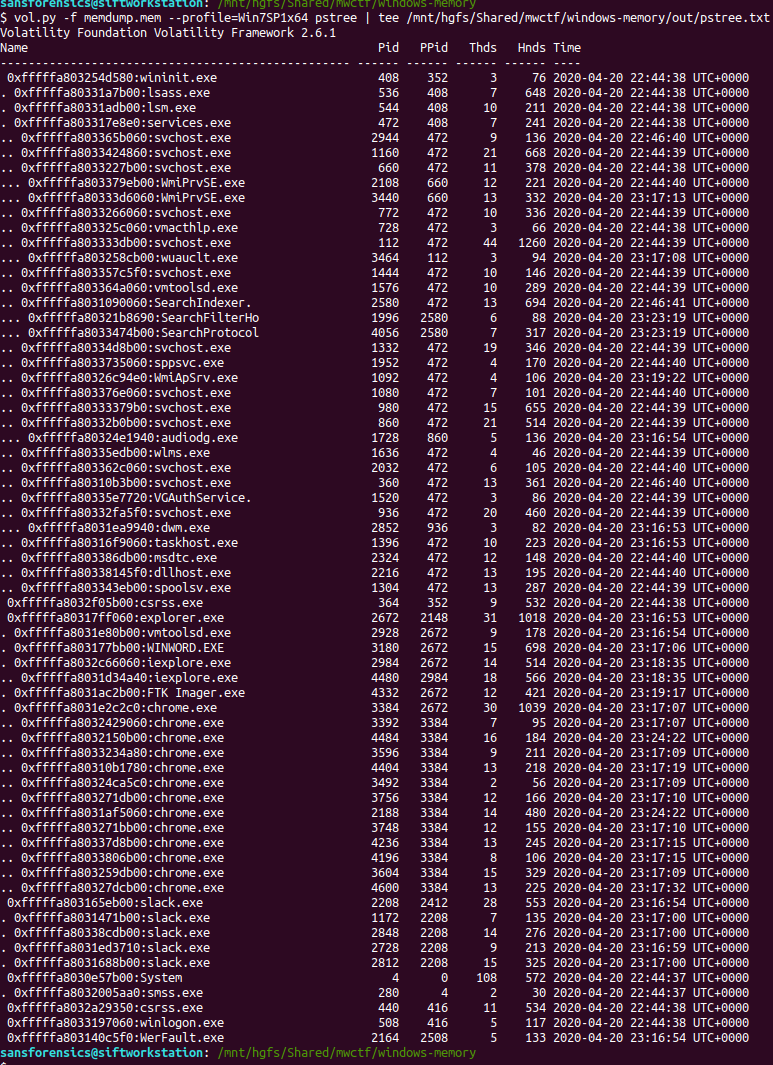
The yarascan plugin finds our string in three different locations, but all within an Internet Explorer process – PID 4480.

Flag (Part 1)

4480

Part 2 (20 points)

What is the product version of the application from Part 1?

XX.XX.XXXX.XXXXX

Part two asks for the version of Internet Explorer that was used. Microsoft suggest a few options to check Internet Explorer release versions; I started by checking the following key in the SOFTWARE registry hive.

grep -E "^Virtual|(SOFTWARE)" out/hivelist.txt
vol.py -f memdump.mem --profile=Win7SP1x64 printkey -o 0xfffff8a0002c9010 -K "Microsoft\Internet Explorer"

We are particularly interested in the value of srcVersion11.0.9600.18860 – but this answer was not accepted. Curious. Maybe the Version value – 9.11.9600.18860 – but again, this was not accepted. I noticed that neither of those strings fit the format hint provided in the question, and reading the Microsoft documentation again I saw that 00 version numbers could be truncated to a single 0. Padding the srcVersion value out to 11.00.9600.18860 might be the answer? No.

Time for a different approach. I used the procdump plugin to dump the process executable from memory, then used exiftool to examine the binary metadata. Sure enough, there was a specific Product Version value.

vol.py -f memdump.mem --profile=Win7SP1x64 procdump -p 4480 -D .
exiftool -ProductVersion executable.4480.exe

Reading the question properly helps!

Flag (Part 2)

11.00.9600.18858

That is the end of the Magnet Weekly CTF, at least for 2020. A big “thank you” to everyone involved in setting-up and running the challenge, and to all the other participants who wrote-up and published their solutions each week!

Magnet Weekly CTF – Week 11

The Magnet Forensics Weekly CTF has been running since October and sets one question each week using an image that changes each month. The October questions were based on an Android filesystem dump, and November’s related to a compromised Hadoop cluster built on Ubuntu Linux. The December challenges return to more familiar territory for me – Windows memory analysis!

These questions use the memory image from the Magnet Virtual Summit 2020, which I first examined during the MVS CTF earlier this year. You can find the rest of my Magnet Weekly CTF write-ups here.

The Week 11 questions were set by Lynita Hinsch and, unusually for a memory analysis challenge, I didn’t use Volatility at all this week. Instead, inspired by Kevin Pagano’s solution for Week 10, I used Bulk Extractor and Wireshark to quickly examine network activity extracted from the memory image.

Part 1 (20 points)

What is the IPv4 address that myaccount.google.com resolves to?

One of my favourite things about the Magnet Weekly CTF is reading write-ups from the other participants. A lot of the time we solve the challenges in the same way, but every so often I come across some technique or tool that I had no idea existed! One such technique was using Bulk Extractor to carve network activity from a memory image into a PCAP file that could then be analysed in Wireshark. I’ve used Bulk Extractor before, but had no idea it could do that!

The following command disables all of the Bulk Extractor modules (-x all), then enables the network module (-e net) and writes output to the specified directory.

bulk_extractor -x all -e net -o bulk-extractor-out/ memdump.mem

A few minutes later we have a PCAP file! From here on this is essentially a network analysis task. Opening the PCAP in Wireshark we can quickly filter the DNS responses for myaccount.google.com:

dns.resp.name == "myaccount.google.com"

In this case the initial response was a CNAME record, which led to the A record, and ultimately to the IPv4 address.

Flag (Part 1)

172.217.10.238

Part 2 (5 points)

What is the canonical name (cname) associated with Part 1?

Wireshark makes this easy. The CNAME record was included in the same DNS response packet, giving us the second flag.

Flag (Part 2)

www3.l.google.com

Magnet Weekly CTF – Week 10

The Magnet Forensics Weekly CTF has been running since October and sets one question each week using an image that changes each month. The October questions were based on an Android filesystem dump, and November’s related to a compromised Hadoop cluster built on Ubuntu Linux. The December challenges return to more familiar territory for me – Windows memory analysis!

These questions use the memory image from the Magnet Virtual Summit 2020, which I first examined during the MVS CTF earlier this year. You can find the rest of my Magnet Weekly CTF write-ups here.

Week 10 is another multi-part question and was set by Jamey Tubbs. This write-up follows on from Week 9 where I made a point of saving my Volatility output for later reference, so you might want to read my Week 9 write-up to see how I approached the initial stages of the analysis.

Part 1 (15 Points)

At the time of the RAM collection (20-Apr-20 23:23:26- Imageinfo) there was an established connection to a Google Server.

What was the Remote IP address and port number? format: “xxx.xxx.xx.xxx:xxx”

We want to examine the network connections that were active at the time the memory dump was captured; the netscan plugin will dump these out for us.

vol.py -f memdump.mem --profile=Win7SP1x64 netscan | tee out/netscan.txt

We are looking specifically for established connections, which can be filtered from the saved output using grep:

grep -E "^Offset|ESTABLISHED" out/netscan.txt

Unfortunately we don’t have any timestamps associated with these connections yet, but using whois it is a simple task to determine which of the four IP addresses belongs to Google:

whois 151.101.116.106 | grep -E "^NetName|^OrgName"
whois 172.253.63.188 | grep -E "^NetName|^OrgName"
whois 13.35.82.31 | grep -E "^NetName|^OrgName"
whois 13.35.82.102 | grep -E "^NetName|^OrgName"

The question asks us to supply the IP address and port number, so back to our list of established connections and submit both as the answer to Part 1.

Flag (Part 1)

172.253.63.188:443

Part 2 (15 points)

What was the Local IP address and port number?

We already know this from our work to answer Part 1.

Flag (Part 2)

192.168.10.146:54282

Part 3 (10 points)

What was the URL?

This part wasn’t so obvious initially. I tried running strings and Volatility’s yarascan plugin looking for any references to the IP address, but did not find anything useful. After looking at the running processes again (saved pstree output) I extracted the Google Chrome browser history…

grep "Chrome\\\User Data\\\Default\\\History" out/filescan.txt
vol.py -f memdump.mem --profile=Win7SP1x64 dumpfiles -Q 0x000000013fdc56b0 -D. -n

…and examined the urls table using sqlite3:

sqlite3 file.None.0xfffffa80311c7eb0.History.dat
sqlite> .headers on
sqlite> SELECT datetime(last_visit_time/1000000-11644473600, "unixepoch") as last_visited, url, title, visit_count FROM urls ORDER BY last_visited DESC LIMIT 1;

The timestamp of the most recently visited URL doesn’t match the time of the memory capture exactly, but it is close enough to be worth submitting.

Flag (Part 3)

https://www.google.com

Part 4 (5 points)

What user was responsible for this activity based on the profile?

Again, we already know the answer to this one based on Part 3, where we extracted the Google Chrome history database from Warren’s user profile.

Flag (Part 4)

Warren

Part 5 (20 points)

How long was this user looking at this browser with this version of Chrome? *format: X:XX:XX.XXXXX * Hint: down to the last second

Now this is the part that caused the most trouble! Part 5 was initially worth 10 points, but later in the week it was assigned an extra 10 points, and a hint was added which could be unlocked by spending some points. In the end, this question was actually pretty simple. I spent more time trying to work out what the question was asking than actually solving it!

We are looking for some record of application execution, and after consulting the SANS Windows Forensic Analysis poster I realised that the UserAssist registry keys would likely hold the answer. The UserAssist keys are held in the user’s ntuser.dat hive, and for reasons only apparent to Microsoft, are ROT13 encoded. As I was mentally preparing myself to extract and decode all these GUIDs I looked again at the list of plugins shipped with Volatility on my SIFT VM, and found Jamie Levy’s amazing userassist plugin!

The userassist plugin produces a lot of output! As usual I redirected this to a file, and used grep to find any data relating to Google Chrome.

vol.py -f memdump.mem --profile=Win7SP1x64 userassist > out/userassist.txt
grep -i -A 11 -E "^REG_BINARY *chrome*" out/userassist.txt

The value we are interested in is Time Focused, which tracks the length of time that a GUI application was active on the screen.

At this point I was pretty sure I had the challenge solved for the week, but my answer of 3:36:47.301000 was rejected. What else could it be? I looked at the question again and counted the length of the formatting hint – my answer was one digit too long. I dropped the trailing 0, and my answer was accepted.

Flag (Part 5)

3:36:47.30100

Magnet Weekly CTF – Week 9

The Magnet Forensics Weekly CTF has been running since October and sets one question each week using an image that changes each month. The October questions were based on an Android filesystem dump, and November’s related to a compromised Hadoop cluster built on Ubuntu Linux. The December challenges return to more familiar territory for me – Windows memory analysis!

These questions use the memory image from the Magnet Virtual Summit 2020, which I first examined during the MVS CTF earlier this year. You can find the rest of my Magnet Weekly CTF write-ups here.

The Week 9 question (all seven parts of it!) was written by Aaron Sparling, and begins with recovering the user’s notes on changing one of their passwords. Let’s go!

Part 1 (25 points)

The user had a conversation with themselves about changing their password. What was the password they were contemplating changing too. Provide the answer as a text string.

I like to use Volatility for memory analysis; version 2.6.1 was installed on my SIFT VM. As usual we begin by determining which profile is best to use with the image using the imageinfo plugin. I’m also piping the output to tee so that everything is written to a text file for reference later on.

vol.py -f memdump.mem imageinfo | tee /mnt/hgfs/Shared/mwctf/windows-memory/out/imageinfo.txt

The imageinfo plugin suggested the Win7SP1x64 profile, which seems sensible enough. The next plugin I like to run is pstree; this will show most of the processes that were running when the memory was captured, giving us an idea of what was happening on the host.

vol.py -f memdump.mem pstree | tee /mnt/hgfs/Shared/mwctf/windows-memory/out/pstree.txt

The question references the user having a conversation so I started off by dumping the memory from the Slack processes and examining the output of strings, but I didn’t find anything useful. Next, I looked at the WINWORD.EXE (PID: 3180) process. Perhaps the user wrote their conversation into a file? I started with the cmdline plugin in the hope that Word was opened with a file path in the command line.

vol.py -f memdump.mem --profile=Win7SP1x64 cmdline -p 3180 | tee /mnt/hgfs/Shared/mwctf/windows-memory/out/cmdline-3180.txt

Unfortunately not, but there are other ways of determining which files a process was using. The handles plugin, with a filters on the process and handle types will output a list of all of the files in use by the Word process.

vol.py -f memdump.mem --profile=Win7SP1x64 handles -p 3180 -t File | tee /mnt/hgfs/Shared/mwctf/windows-memory/out/handles-3180-file.txt

One file stood out – AutoRecovery save of Document1.asd – from user Warren’s profile. This file might not exist on disk anymore, but we can probably extract it from the memory dump. The first step is to run the filescan command, saving the output to a file for use later.

vol.py -f memdump.mem --profile=Win7SP1x64 filescan | tee /mnt/hgfs/Shared/mwctf/windows-memory/out/filescan.txt

Next I used grep to locate the physical offset of the file, then ran the dumpfiles Volatility plugin to extract the file from the memory image.

grep "AutoRecovery save of Document1.asd" out/filescan.txt
vol.py -f memdump.mem --profile=Win7SP1x64 dumpfiles -Q 0x000000013e6de810 -D. -n

Opening the extracted file with LibreOffice, we can see the user’s conversation with themselves, and their proposed new password.

Flag (Part 1)

wow_this_is_an_uncrackable_password

Part 2 (15 points)

What is the md5 hash of the file which you recovered the password from?

This part is easy enough. We have already extracted the auto-recovery document so all we need to do is calculate the MD5 hash.

md5sum file.None.0xfffffa803316f710.AutoRecovery\ save\ of\ Document1.asd.dat

Flag (Part 2)

af1c3038dca8c7387e47226b88ea6e23

Part 3 (15 points)

What is the birth object ID for the file which contained the password?

On a NTFS filesystem, every entry in the Master File Table (MFT) contains a number of GUIDs which make up the $OBJECT_ID attribute. While the Object ID might change over the life of the file, the Birth Object ID is a record of the first Object ID assigned and should never change.

We can extract the MFT as it existed at the time of the memory capture using Volatility’s mftparser plugin. You will almost always want to redirect the output of mftparser to a file and, as per the warning, the parser can take a while (although more likely minutes than hours!) The other warnings during the extraction don’t appear to have had any ill effect on the rest of the analysis.

vol.py -f memdump.mem --profile=Win7SP1x64 mftparser --output-file=out/mftparser.txt

Once mftparser has completed we can search for the MFT entry related to the AutoRecovery file using grep; the -B 20 and -A 11 options print the 20 lines before the matching line, and 11 lines after, just to keep the output tidy.

grep -B 20 -A 11 "AutoRecovery save of Document1.asd" out/mftparser.txt

The $OBJECT_ID attribute is printed at the bottom of the entry, including the Birth Object ID value.

Flag (Part 3)

31013058-7f31-01c8-6b08-210191061101

Part 4 (20 points)

What is the name of the user and their unique identifier which you can attribute the creation of the file document to?

Format: #### (Name)

We know that the AutoRecovery document was stored in the profile for user Warren. We could dig into the registry to link each ProfileImagePath to its SID and RID values, but a big part of memory analysis is quick wins and I know that the hashdump plugin will print the username, RID, and NTLM hash for each local account on the box. Based on the format hint in the question, the RID and username are all we need for now.

vol.py -f memdump.mem --profile=Win7SP1x64 hashdump | tee /mnt/hgfs/Shared/mwctf/windows-memory/out/hashdump.txt

There we go – user account Warren has RID 1000. Not too surprising as this is the only user account other than the built-in Administrator and Guest accounts, but now we have confirmed it. The NTLM hash isn’t really of any use to us at the moment, but credentials and hashes are always nice to have around.

Flag (Part 4)

1000 (Warren)

Part 5 (25 points)

What is the version of software used to create the file containing the password?

Format ## (Whole version number, don’t worry about decimals)

Ok now we have to dig into the registry! Volatility has a printkey plugin that is smart enough to query each registry hive it finds and print all of the results, but we can be more targeted by specifying which registry hive we are interested in first. The hivelist plugin displays the virtual and physical offsets for each of the hives it is able to find. Again, this will likely be useful later on so write the output to a file.

vol.py -f memdump.mem --profile=Win7SP1x64 hivelist | tee /mnt/hgfs/Shared/mwctf/windows-memory/out/hivelist.txt

I looked in the ntuser.dat hive associated the Warren user account. This hive contains, among other useful things, data about software installed by the user. Now we have the offset for the hive, we can run the printkey plugin and pull the data relating to the Microsoft Office installation.

vol.py -f memdump.mem --profile=Win7SP1x64 printkey -o 0xfffff8a003ebd010 -K "SOFTWARE\Microsoft\Office"

Now, I wasn’t completely sure of the answer at this point. The Subkeys 11.0, 12.0, 14.0, and 15.0 all relate to Office versions, but which one is correct? After a bit more digging I found another registry key, this time in the HKLM\Software hive, that confirmed which version was correct.

vol.py -f memdump.mem --profile=Win7SP1x64 printkey -o 0xfffff8a0002c9010 -K "Classes\Word.application\curVer"

Version 15 corresponds to Microsoft Office 2003, but thanks to the format hint we know that 15 is enough.

Flag (Part 5)

15

Part 6 (20 points)

What is the virtual memory address offset where the password string is located in the memory image?

Format: 0x########

This part caused me the most trouble. I knew how to easily find the physical offset using the strings utility and grep, but how to find the virtual offset? I recalled that Volatility has its own strings plugin, and after reading some Volatility documentation, I was able to link the physical offset to the virtual one.

Rather than outputting every string in the image, the Volatility strings plugin takes a specially formatted list of physical offsets and strings as an input, displaying the matching virtual offsets. Cool. First thing is to build the input list in the following format:

<physical offset (decimal)>:<string>

After some trial and error involving sed, awk, and cut I gave up and used the Windows Sysinternals strings64.exe utility (as suggested by the Volatility documentation!) which creates this form of output by default. Dropping back to my Windows 7 host, I dumped the strings64.exe output to my shared directory:

>strings64.exe -o memdump.mem > out/strings-physical-dec.txt

Back to SIFT and we can see that we have the required format: physical offsets in decimal representation, and the associated strings, colon-separated.

We are only really interested in the strings matching the password from Part 1, so we filter these using grep, writing the result to a file – this will be the input for the Volatility strings plugin.

head out/strings-physical-dec.txt
grep "wow_this_is_an_uncrackable_password" out/strings-physical-dec.txt | tee out/strings-physical-dec-flag1.txt

Now that the input file is formatted correctly we can throw Volatility’s own strings plugin at the image.

vol.py -f memdump.mem --profile=Win7SP1x64 strings -s out/strings-physical-dec-flag1.txt | tee out/volstrings-flag1.txt

The output format is as follows:

<physical offset (decimal)> [<pid>:<virtual offset (hex)>] <string>

I wasn’t sure which of the resulting virtual offsets was the correct one so tried the first match, which was accepted.

Flag (Part 6)

0x02180a2d

Part 7 (20 points)

What is the physical memory address offset where the password string is located in the memory image?

Format: 0x########

Ok, this one was much easier. We already have the physical offset, only it is represented in decimal and the format hint specifies a hex representation. No problem though, CyberChef can fix that easily!

There we go. Solved. But just to make sure I also ran strings over the memory image from within my SIFT VM with the -t x flag to specify that offsets should be printed as hex rather than decimal. Searching for the password with grep returns a single hit, matching nicely with the value from CyberChef.

strings -t x memdump.mem > out/strings-physical-hex.txt
grep "wow_this_is_an_uncrackable_password" out/strings-physical-hex.txt

Flag (Part 7)

0xaf12a2d

Magnet Weekly CTF – Week 8

The Magnet Forensics Weekly CTF has been running since October and sets one question each week using an image that changes each month. The October questions were based on an Android filesystem dump. November’s image is Linux, more specifically a Hadoop cluster comprising of three E01 files. The images were created by Ali Hadi as part of his OSDFCon 2019 Linux Forensics workshop; the November CTF questions are based on Case 2, which can be downloaded here.

This was another two-part challenge; identify what was installed following a compromise, then determine why. You can find my other Magnet Weekly CTF write-ups here.

Part 1

What package(s) were installed by the threat actor? Select the most correct answer!

The question as written doesn’t mention which of the images are in scope, but the on the video announcement for the question Ali Hadi specified the question refers to the primary node (HDFS-Master.E01). As usual I started by mounting the mounting the image using ewfmount.

# ewfmount /mnt/hgfs/Shared/mwctf/linux/HDFS-Master.E01 /mnt/ewf
# losetup --read-only --offset $((2048*512)) /dev/loop20 /mnt/ewf/ewf1
# mount -o ro,noload,noexec /dev/loop20 /mnt/ewf_mount/

Initially I thought the “threat actor” referenced in the question was another bit of wordplay that I have completely missed so often over the last questions; “threat actor” to “Advanced Persistent Threat” to the “apt” package manager. I suspect I’m seeing connections that weren’t intended, but the apt/history log is where I found the answer to Part 1.

Assuming that the most recent entries in the log would point toward the threat actor, I used the tail command.

tail /mnt/ewf_mount/var/log/apt/history.log

Using the default options tail shows the two most recent apt executions from the log: the first looks like a Linux kernel upgrade, and the second installed php and the associated packages for PHP 7.0

I found the “select the most correct answer” comment to be a bit vague but my first answer of php was accepted.

One interesting point from the log: note the length of time between apt recording any package management activity.

Start-Date: 2017-11-08 06:12:58
Commandline: /usr/bin/unattended-upgrade

Start-Date: 2019-10-07 01:30:31
Commandline: apt install php

Almost two years between the commands! Timezones are hard, but it’s probably a safe assumption that the host was compromised around the 7th of October 2019.

Flag (Part 1)

php

Part 2

Why? (two attempts)

  • hosting a database
  • serving a webpage
  • to run a php webshell
  • create a fake systemd service

Part 2 simply asks why? Four options are provided, but with only two attempts available we need to do some analysis rather than just guessing. That being said though, the first two options seemed unlikely post-compromise activities, so I began by investigating the systemd services.

The systemd service descriptions are stored in the /etc/systemd/system directory:

ll /mnt/ewf_mount/etc/systemd/system/

Based on the timestamp alone the cluster.service file stands out. But the 6th of October 2019 is earlier than the PHP installation we found in Part 1. Let’s get the inode number and check with istat:

ll -i /mnt/ewf_mount/etc/systemd/system/cluster.service
sudo istat -o 2048 /mnt/ewf/ewf1 2229804

File Created: 2019-10-06 22:28:16.492115650 (UTC)

That’s better. My SIFT VM is configured to use UTC locally. It seems that the timestamps written into the log entries will need to be manually adjusted. Timezones are still hard.

Now, let’s look at the service description file itself.

cat /mnt/ewf_mount/etc/systemd/system/cluster.service

That’s interesting! The service starts as the root user (suggesting some privilege escalation) and executes a PHP file. Let’s check that out.

cat /mnt/ewf_mount/usr/local/hadoop/bin/cluster.php

There’s our PHP shell! Binding to port 17001 and executing commands using the shell_exec function.

This is another point that I found the question to be a little unclear. We do have a fake systemd service, but that service calls a PHP shell. It seems that the threat actor had elevated privileges to allow the service creation regardless of whether PHP was installed, so PHP is only really necessary to run the PHP shell. Unfortunately, that answer was incorrect. I guess our PHP shell is just a bind shell rather than specifically a webshell, but nevermind.

We have one attempt left, and we definitely have a fake systemd service, so no harm done.

Flag (Part 2)

create a fake systemd service

That wraps up the Linux analysis challenges! December will focus on Windows memory analysis – specifically the memory image from the 2020 Magnet Virtual Summit CTF which I wrote-up back in June.

Magnet Weekly CTF – Week 7 – Domains and Such

The Magnet Forensics Weekly CTF has been running since October and sets one question each week using an image that changes each month. The October questions were based on an Android filesystem dump. November’s image is Linux, more specifically a Hadoop cluster comprising of three E01 files. The images were created by Ali Hadi as part of his OSDFCon 2019 Linux Forensics workshop; the November CTF questions are based on Case 2, which can be downloaded here.

This week was another multi-part challenge – three questions related to the network configuration of the primary node. You can find my other Magnet Weekly CTF write-ups here.

Part 1 (15 points)

What is the IP address of the HDFS primary node?

We start, as usual, by mounting the E01 image for the primary node (HDFS-Master.E01). Based on the Week 5 challenge we know that the sector offset for the beginning of the primary partition is 2048, and the sector size is 512 bytes.

# ewfmount /mnt/hgfs/Shared/mwctf/linux/HDFS-Master.E01 /mnt/ewf
# losetup --read-only --offset $((2048*512)) /dev/loop20 /mnt/ewf/ewf1
# mount -o ro,noload,noexec /dev/loop20 /mnt/ewf_mount/

Compared to the previous Linux challenges this one is pretty straightforward. The location that immediately comes to mind when dealing with network configuration is the interfaces file.

cat /mnt/ewf_mount/etc/network/interfaces

This file is used to configure the network interfaces available on the host, and contains all the information we need to complete this week’s challenge.

First, the IP address is listed as 192.168.2.100

Flag (Part 1)

192.168.2.100

Part 2 (5 points)

Is the IP address on HDFS-Primary dynamically or statically assigned?

The interface is statically assigned, rather than using DHCP.

Flag (Part 2)

statically

Part 3 (5 points)

What is the interface name for the primary HDFS node? (2 attempts)

The host has two network interfaces configured. Given that the first two parts have referred to the statically configured one, ens33 is a safe bet.

Flag (Part 3)

ens33

Digging into DHCP

That completes the Week 7 challenge but I started thinking about the DHCP configuration of the other interface, and where I might find more details. After some searching I found the following files, one for each interface:

/var/lib/dhcp/dhclient.enp0s3.leases
/var/lib/dhcp/dhclient.ens36.leases

These files contain the DHCP lease details for each interface, and while they were not relevant in this challenge, might be a good source for future investigations.

sansforensics@siftworkstation: ~
$ cat /mnt/ewf_mount/var/lib/dhcp/dhclient.enp0s3.leases 
lease {
interface "enp0s3";
fixed-address 192.168.2.100;
option subnet-mask 255.255.255.0;
option routers 192.168.2.222;
option dhcp-lease-time 86400;
option dhcp-message-type 5;
option domain-name-servers 192.168.2.222,192.168.88.1;
option dhcp-server-identifier 192.168.2.222;
option broadcast-address 192.168.2.255;
option domain-name "w1re";
renew 4 2017/11/09 00:14:43;
rebind 4 2017/11/09 00:14:43;
expire 4 2017/11/09 00:14:43;
}
sansforensics@siftworkstation: ~
$
sansforensics@siftworkstation: ~
$ cat /mnt/ewf_mount/var/lib/dhcp/dhclient.ens36.leases 
lease {
interface "ens36";
fixed-address 172.16.64.137;
option subnet-mask 255.255.255.0;
option routers 172.16.64.2;
option dhcp-lease-time 1800;
option dhcp-message-type 5;
option domain-name-servers 172.16.64.2;
option dhcp-server-identifier 172.16.64.254;
option broadcast-address 172.16.64.255;
option netbios-name-servers 172.16.64.2;
option domain-name "localdomain";
renew 0 2019/10/06 21:20:30;
rebind 0 2019/10/06 21:20:30;
expire 0 2019/10/06 21:20:30;
}
lease {
interface "ens36";
fixed-address 172.16.64.137;
option subnet-mask 255.255.255.0;
option routers 172.16.64.2;
option dhcp-lease-time 1800;
option dhcp-message-type 5;
option domain-name-servers 172.16.64.2;
option dhcp-server-identifier 172.16.64.254;
option broadcast-address 172.16.64.255;
option netbios-name-servers 172.16.64.2;
option domain-name "localdomain";
renew 0 2019/10/06 21:35:23;
rebind 0 2019/10/06 21:49:23;
expire 0 2019/10/06 21:53:08;
}
lease {
interface "ens36";
fixed-address 172.16.64.137;
option subnet-mask 255.255.255.0;
option routers 172.16.64.2;
option dhcp-lease-time 1800;
option dhcp-message-type 5;
option domain-name-servers 172.16.64.2;
option dhcp-server-identifier 172.16.64.254;
option broadcast-address 172.16.64.255;
option netbios-name-servers 172.16.64.2;
option domain-name "localdomain";
renew 0 2019/10/06 21:48:26;
rebind 0 2019/10/06 22:01:38;
expire 0 2019/10/06 22:05:23;
}
lease {
interface "ens36";
fixed-address 172.16.64.137;
option subnet-mask 255.255.255.0;
option routers 172.16.64.2;
option dhcp-lease-time 1800;
option dhcp-message-type 5;
option domain-name-servers 172.16.64.2;
option dhcp-server-identifier 172.16.64.254;
option broadcast-address 172.16.64.255;
option netbios-name-servers 172.16.64.2;
option domain-name "localdomain";
renew 0 2019/10/06 22:02:30;
rebind 0 2019/10/06 22:14:41;
expire 0 2019/10/06 22:18:26;
}
lease {
interface "ens36";
fixed-address 172.16.64.137;
option subnet-mask 255.255.255.0;
option routers 172.16.64.2;
option dhcp-lease-time 1800;
option dhcp-message-type 5;
option domain-name-servers 172.16.64.2;
option dhcp-server-identifier 172.16.64.254;
option broadcast-address 172.16.64.255;
option netbios-name-servers 172.16.64.2;
option domain-name "localdomain";
renew 0 2019/10/06 22:16:55;
rebind 0 2019/10/06 22:28:45;
expire 0 2019/10/06 22:32:30;
}
lease {
interface "ens36";
fixed-address 172.16.64.137;
option subnet-mask 255.255.255.0;
option routers 172.16.64.2;
option dhcp-lease-time 1800;
option dhcp-message-type 5;
option domain-name-servers 172.16.64.2;
option dhcp-server-identifier 172.16.64.254;
option broadcast-address 172.16.64.255;
option netbios-name-servers 172.16.64.2;
option domain-name "localdomain";
renew 0 2019/10/06 22:31:54;
rebind 0 2019/10/06 22:43:10;
expire 0 2019/10/06 22:46:55;
}
lease {
interface "ens36";
fixed-address 172.16.64.137;
option subnet-mask 255.255.255.0;
option routers 172.16.64.2;
option dhcp-lease-time 1800;
option dhcp-message-type 5;
option domain-name-servers 172.16.64.2;
option dhcp-server-identifier 172.16.64.254;
option broadcast-address 172.16.64.255;
option netbios-name-servers 172.16.64.2;
option domain-name "localdomain";
renew 0 2019/10/06 22:45:49;
rebind 0 2019/10/06 22:58:09;
expire 0 2019/10/06 23:01:54;
}
lease {
interface "ens36";
fixed-address 172.16.64.137;
option subnet-mask 255.255.255.0;
option routers 172.16.64.2;
option dhcp-lease-time 1800;
option dhcp-message-type 5;
option domain-name-servers 172.16.64.2;
option dhcp-server-identifier 172.16.64.254;
option broadcast-address 172.16.64.255;
option netbios-name-servers 172.16.64.2;
option domain-name "localdomain";
renew 0 2019/10/06 22:59:47;
rebind 0 2019/10/06 23:12:04;
expire 0 2019/10/06 23:15:49;
}
sansforensics@siftworkstation: ~
$

Magnet Weekly CTF – Week 6 – The Elephant in the Room

The Magnet Forensics Weekly CTF has been running since October and sets one question each week using an image that changes each month. The October questions were based on an Android filesystem dump. November’s image is Linux, more specifically a Hadoop cluster comprising of three E01 files. The images were created by Ali Hadi as part of his OSDFCon 2019 Linux Forensics workshop; the November CTF questions are based on Case 2, which can be downloaded here.

This week is a little different and split into two parts, with the second part revealed once the first has been successfully answered. You can find my other Magnet Weekly CTF write-ups here.

Part 1 (25 points)

Hadoop is a complex framework from Apache used to perform distributed processing of large data sets. Like most frameworks, it relies on many dependencies to run smoothly. Fortunately, it’s designed to install all of these dependencies automatically. On the secondary nodes (not the MAIN node) your colleague recollects seeing one particular dependency failed to install correctly. Your task is to find the specific error code that led to this failed dependency installation. [Flag is numeric]

We have three E01 images making up the Hadoop cluster – Master, Slave1, Slave2 – and this time we are looking at either Slave1 or Slave2. I started with Slave1, and mounted the E01 file in the same way as in the Week 5 challenge. From a root shell:

# ewfmount /mnt/hgfs/Shared/mwctf/linux/HDFS-Slave1.E01 /mnt/ewf
# mmls /mnt/ewf/ewf1
# losetup --read-only --offset $((2048*512)) /dev/loop20 /mnt/ewf/ewf1
# mount -o ro,noload,noexec /dev/loop20 /mnt/ewf_mount/

Now we have the main ext4 partition mounted we can get on with the analysis. We are looking for logs relating to package management; checking the release information the underlying system is Ubuntu 16.04 so the APT package manager seems a reasonable place to start looking.

cat /mnt/ewf_mount/etc/lsb-release

APT keeps two logs under the /var/log/apt directory:

/var/log/apt/history.log
/var/log/apt/term.log

Checking history.log first, I found that the oracle-java7-installer, oracle-java8-installer, and oracle-java9-installer packages all failed to install correctly. Hadoop requires Java to function, so this is looking good.

less /mnt/ewf_mount/var/log/apt/history.log

The history.log file shows that the dpkg sub-process failed with error code 1; unfortunately this isn’t the answer we are looking for, so let’s try term.log instead.

We can quickly filter the errors using grep, with the -C 5 argument to provide some context around the matches.

cat /mnt/ewf_mount/var/log/apt/term.log | grep -C 5 "ERROR"

Examining the grep output from term.log, we find that the oracle-java7-installer package failed to download, resulting in the dpkg error we saw in history.log, but now we see the HTTP 404 error code indicating that the package file was not found. Submit this error code, and we have completed Part 1!

Flag (Part 1)

404

Part 2 (50 points)

Don’t panic about the failed dependency installation. A very closely related dependency was installed successfully at some point, which should do the trick. Where did it land? In that folder, compared to its binary neighbors nearby, this particular file seems rather an ELFant. Using the error code from your first task, search for symbols beginning with the same number (HINT: leading 0’s don’t count). There are three in particular whose name share a common word between them. What is the word?

The question is a bit of a riddle, but given that the oracle-java packages failed to install, and we know from Week 5 that the Java JDK was installed to /usr/local/jdk1.8.0_151 so there’s a starting point. The question also references binary files and ELF, which is a standard binary format on Linux systems, so my guess is that we need to examine the symbol table within the ELF binaries.

The Java binaries are contained in the /usr/local/jdk1.8.0_151/bin directory.

ll /mnt/ewf_mount/usr/local/jdk1.8.0_151/bin/

We can check the file types using the file command, and filter the ELF executables using grep:

file /mnt/ewf_mount/usr/local/jdk1.8.0_151/bin/* | grep "ELF"
file /mnt/ewf_mount/usr/local/jdk1.8.0_151/bin/* | grep "ELF" | wc -l

According to the file output there are 42 binaries; we can dump the symbol tables using the readelf utility, but which executable are we looking for? Rather than checking each file individually, I dumped the symbol table from all of the binaries (sending the error messages to /dev/null) and used grep to filter out “404“.

readelf --symbols /mnt/ewf_mount/usr/local/jdk1.8.0_151/bin/* 2>/dev/null | grep 404

We are looking for a common word, shared between three symbols. One jumps out – deflate.

The answer was accepted but for completeness sake, let’s find out which executable the question referred to.

readelf --symbols /mnt/ewf_mount/usr/local/jdk1.8.0_151/bin/* 2>/dev/null | grep -E "File: |404" | grep -B 1 "deflate"

Employing a bit of grep-fu to tidy things up, we can see that the executable in question is:

/mnt/ewf_mount/usr/local/jdk1.8.0_151/bin/unpack200

Flag (Part 2)

deflate

Magnet Weekly CTF – Week 5 – Had-A-Loop Around the Block

The Magnet Forensics Weekly CTF has been running since October and sets one question each week using an image that changes each month. The October questions were based on an Android filesystem dump. November’s image is Linux, more specifically a Hadoop cluster comprising of three E01 files. The images were created by Ali Hadi as part of his OSDFCon 2019 Linux Forensics workshop; the November CTF questions are based on Case 2, which can be downloaded here.

You can find my other Magnet Weekly CTF write-ups here.

Had-A-Loop Around the Block (75 points)

What is the original filename for block 1073741825?

New month, new image. I’ve done some Linux forensics before but never anything involving Hadoop. And this question is worth 75 points. Week 3 was only worth 40 so this gives an indication that it’s going to be a long one!

The Case 2 image set is comprised of three hosts:

  • HDFS-Master
  • HDFS-Slave1
  • HDFS-Slave2

I started with HDFS-Master.E01 just because it seemed like a sensible place to begin. The first thing to do is mount the disk image and see what we have.

Part 1 – Mounting E01 files using SIFT Workstation

Most Linux forensics tools are happiest when they are working with raw disk images. The fact we have Expert Witness Format (E01) files complicates things a little, but not too much.

I like to use free or open-source tools as far as possible for CTFs so we are going to mount the image as a loopback device using ewfmount and tools from The Sleuthkit – all available in the SANS SIFT virtual machine.

One of the advantages of E01 files is that they can also contain case metadata. We can view this metadata using the ewfinfo tool.

ewfinfo /mnt/hgfs/Shared/mwctf/linux/HDFS-Master.E01

Before we create the loopback device we need to get our E01 file into something resembling a raw disk image. We could convert the E01 to raw using ewfexport but that takes time and expands our image to the full 80GB disk. Instead, we will use ewfmount to create something the standard Linux tools can work with.

sudo ewfmount /mnt/hgfs/Shared/mwctf/linux/HDFS-Master.E01 /mnt/ewf

efwmount creates a read-only, virtual raw disk image located at /mnt/ewf/ewf1. The next thing to do is check on the geometry of the disk.  I used mmls from The Sleuthkit to dump the partition table; we’ll need this data for the next step.

(From here on I had to sudo to a root shell due to the permissions that ewfmount left me with)

sudo -s
# mmls /mnt/ewf/ewf1

Partition 002 is the one we are interested in. Its description tells us it is Linux ext2/3/4 and the length means it is the largest single partition on the disk. The part we need to take note of for now is the Start sector offset: 2048. We will use this later to mount the partition. First though, let’s get some more information about the filesystem on the partition.

# fsstat -o 2048 /mnt/ewf/ewf1 | tee /home/sansforensics/mwctf/fsstat-2048.out

The fsstat command gives us a lot of information that might be useful later on, so I used tee to save the output to a file. The output confirms that we are dealing with an ext4 filesystem which, helpfully, was unmounted correctly! Now, we can move on and create the loopback device which will then allow us to mount the filesystem.

# losetup --read-only --offset $((2048*512)) /dev/loop20 /mnt/ewf/ewf1
# file -s /dev/loop20

This step gave me a lot of problems relating to the loop device being “unavailable”; losetup should be smart enough to use the next available device without prompting, but eventually I found that if I set the device myself (/dev/loop20, in my case) the command succeeded. The other aspects to note are that I created the loopback device as read-only – ewfmount already created a read-only device for us, but practice safe mounting – and that the offset value is the sector offset from mmls (2048) multiplied by the sector size in bytes (512).

Now we can move on to the final stage of preparation and actually mount the filesystem.

# mount -o ro,noload,noexec /dev/loop20 /mnt/ewf_mount/

I also ran into a problem with my initial attempt to mount the filesystem. I suspect this was because the journal was in need of recovery (as per the file -s output above). Adding the noload option tells the filesystem driver to ignore the journal errors, and allows us mount the filesystem successfully! Again, read-only.

Part 2 – ext4 Block Analysis

Now we have the filesystem mounted we can get going on the analysis. The question asks for the filename for block 1073741825. My first thought was the ext4 block. I have recovered deleted files from ext4 in the past by working from the inode via the block group, to the raw blocks on disk (Hal Pomeranz gave an excellent webcast covering exactly this scenario), maybe I can work backwards from the block number?

But that block number looks awfully large, especially for an 80GB disk. Let’s take another look at our saved fsstat output.

cat mwctf/fsstat-2048.out | grep -A 6 "CONTENT INFORMATION"

The question asks about block number 1,073,741,825 but the filesystem only contains 20,446,976 blocks. Okay, so we are not looking for an ext4 block. But, this is a Hadoop cluster. How does Hadoop store data?

Part 3 – Investigating Hadoop

The best resource I found to get a quick overview of performing forensic analysis of Hadoop (rather than using Hadoop to perform analysis) was Kevvie Fowler’s helpfully titled Hadoop Forensics presentation from the 2016 SANS DFIR Summit. Armed with this and some Googling, I located the Hadoop installation and data in the following directory:

/mnt/ewf_mount/usr/local/hadoop

I was looking for the namenode location, which hold the fsimage files, which in turn, hold the metadata we are looking for. I found this by examining the hdfs-site.xml configuration file:

cat /mnt/ewf_mount/usr/local/hadoop/etc/hadoop/hdfs-site.xml

Looking under the namenode directory we find the fsimage files. The edits_ files can be thought of as being like transaction logs; best-practice would be to merge these before doing the analysis but for our needs this wasn’t necessary.

ll /mnt/ewf_mount/usr/local/hadoop/hadoop2_data/hdfs/namenode/current

Now that we have found the fsimage files, we need to get intelligible data out of them. Hadoop makes heavy use of a utility named hdfs. Among the many functions hdfs provides is the Offline Image Viewer (oiv) which can be used to parse the fsimage files and output something human-readable . That sounds exactly what we are after, the next problem is how to run it!

I don’t have Hadoop on my SIFT VM and installing it looks a bit fiddly, but we have a disk image from a (presumably) working Hadoop installation so maybe we can use that instead?

ll /mnt/ewf_mount/usr/local/hadoop/bin/

This is where things get a bit hacky. I mounted the filesystem using the noexec option as a protection against accidentally executing scripts and binaries from the disk image, but now that’s exactly what I want to do, so I unmounted and remounted the filesystem to allow this.

# umount /mnt/ewf_mount
# mount -o ro,noload /dev/loop20 /mnt/ewf_mount/

However, the Offline Image Viewer (hdfs oiv) throws an error because the Java path is incorrect.

/mnt/ewf_mount/usr/local/hadoop/bin/hdfs oiv -h

The Offline Image Viewer is looking for Java under /usr/local/ instead of /mnt/ewf_mount/usr/local/ taking the mounted disk image into account. I tried inspecting the script and exporting a new $JAVA_HOME environment variable, but it seems the Offline Image Viewer is taking the variable from a file, and as we are working on a read-only filesystem, we can’t easily change that. So instead of fighting to get the Offline Image Viewer to recognise an updated path, I simply copied the Java installation from the image to my native /usr/local directory and tried again.

sudo cp -r /mnt/ewf_mount/usr/local/jdk1.8.0_151 /usr/local
/mnt/ewf_mount/usr/local/hadoop/bin/hdfs oiv -h

Better! We have an exception because hdfs cannot write to its log file on a read-only filesystem, but the Offline Image Viewer runs! Let’s see if it can extract anything from the imagefs files we identified earlier.

/mnt/ewf_mount/usr/local/hadoop/bin/hdfs oiv -i /mnt/ewf_mount/usr/local/hadoop/hadoop2_data/hdfs/namenode/current/fsimage_0000000000000000024 -o /home/sansforensics/mwctf/fsimage_24.xml -p XML

We have the same exception because of the read-only filesystem, but…

cat /home/sansforensics/mwctf/fsimage_24.xml

… we have an XML file! After making the XML look pretty and searching for the block number, we find our answer in the name tag.

Week 5 done!

Flag

AptSource

Magnet Weekly CTF – Week 4 – Animals That Never Forget

Magnet Forensics have announced a weekly CTF running from October 2020. A new challenge will be released each week on Monday, and the first few are based on an Android filesystem dump. You can find my other Magnet Weekly CTF write-ups here.

MD5: 3bb6abb3bf6d09e3e65d20efc7ec23b1
SHA1: 10cc6d43edae77e7a85b77b46a294fc8a05e731d

The Week 3 challenge really increased the difficulty, involving a bit of file carving to determine the location a photograph was captured. This week though I mostly relied on luck. And grep.

Animals That Never Forget (25 points)

Chester likes to be organized with his busy schedule. Global Unique Identifiers change often, just like his schedule but sometimes Chester enjoys phishing. What was the original GUID for his phishing expedition?

I really had no idea where to start with this one. Calendar data? ALEAPP says no. I decided to simply extract the evidence TAR file and grep through the dump for phish saving the output for later with tee.

grep -r -i 'phish' MUS_Android/data/ | tee grep_phish.out

Not a bad start. We have a lot of matches in binary files so let’s exclude those from the output and see what’s left.

cat grep_phish.out | grep -v '^Binary file ' | grep -i 'phish'

Better! We have a few matches in a log belonging to the Evernote application, and we might even have our answer already!

oldGuid=7605cc68-8ef3-4274-b6c2-4a9d26acabf1

As with Week 3, we only have three attempts to answer this so let’s dig into the log file and see what else we can find.

grep 'oldGuid=' MUS_Android/data/data/com.evernote/files/logs/log_main.txt

The oldGuid key appears four times, along with timestamps; the question asks for the original GUID, presumably the earliest one in the file. We can use grep again to show only the lines relating to our phishing note.

grep 'oldGuid=' MUS_Android/data/data/com.evernote/files/logs/log_main.txt | grep 'title=Phishy Phish phish'

The first hit is the earlier of the two so things are looking good. The screenshot below highlights the oldGuid value.

I think that’s probably enough to verify that we at least have a reasonable answer before burning one of the three attempts. Submit the oldGuid value and we have successfully completed the Week 4 challenge!

Flag

7605cc68-8ef3-4274-b6c2-4a9d26acabf1

Magnet Weekly CTF – Week 3 – Cargo Hold

Magnet Forensics have announced a weekly CTF running from October 2020. A new challenge will be released each week on Monday, and the first few are based on an Android filesystem dump. You can find my other Magnet Weekly CTF write-ups here.

MD5: 3bb6abb3bf6d09e3e65d20efc7ec23b1
SHA1: 10cc6d43edae77e7a85b77b46a294fc8a05e731d

The Week 1 and Week 2 challenges didn’t require too much in terms of analysis – some UNIX file knowledge, and some output parsed by ALEAPP – Week 3 really stepped up the difficulty!

Cargo Hold (40 points)

Which exit did the device user pass by that could have been taken for Cargo?

Max of 3 attempts

Ok, so we are looking for location data of some kind and something relating to cargo. I found some references to airport (and bus) WiFi in the ALEAPP Wi-Fi Profiles report but ALEAPP didn’t give me anything specifically relating to locations so I moved on from that.

In the video announcing the Week 3 question, Jessica Hyde specifically called-out a presentation she gave with Christopher Vance comparing similar artefacts on Android and iOS devices hinting (quite strongly) that it might be helpful. The location data provided by Google Takeout sounds exactly what we need here, but we don’t have Google Takeout data, so on to the next idea.

The next thing to stand out was the device media store – the photos and videos captured by the device camera – which can (but don’t always) contain location data in their EXIF metadata. I started with the default camera storage directory…

/data/media/0/DCIM/Camera

…and extracted a total of 53 images and videos using FTK Imager.

Switching to my SIFT virtual machine, based on the coordinates in the EXIF there were some nice photos taken in Norway, and a few around New York. There was nothing obviously related to cargo, but one photo showed a truck on what seems to be a US highway, with part of a signpost in the background. Trucks carry cargo, signposts point to exits. Curious.

MVIMG_20200305_145544.jpg

The EXIF data for this photo contains GPS data:

GPS Position: 42 deg 42' 39.97" N, 73 deg 49' 26.94" W

Massaging that to satisfy Google Maps, we can see that this photo was taken on Highway 87 north of Albany, New York.

Dropping to Street View looks promising.

There we go! We have a photo of a cargo truck passing exit 2E. Week 3 done…

…or not.

One attempt down, two attempts left. Let’s think again.

The next artefact examined in the iOS/Android comparison presentation was Android Motion Photos. These are equivalent to iOS Live Photos and, in addition to taking a photo, records a video of roughly 1.5 seconds on either side of the photo capture.

Taking a closer look at the name of the truck photo, I noticed it is not IMG… but rather MVIMG… so we are indeed dealing with Motion Photos. This is the exact scenario Jessica Hyde sets out. We may not be able to see location details in the still image, but the video might show us something interesting. So how do we get to the video?

I found a great blog post outlining how Motion Photo files are structured, and put together a quick Bash script to extract the videos from our 8 Motion Photo files:

#!/bin/bash

INPUT_FILENAME="$1"
FILESIZE=$(stat -c%s "$INPUT_FILENAME")

MICRO_VIDEO_OFFSET=$(exiftool -MicroVideoOffset -s -s -s $INPUT_FILENAME)
OUTPUT_FILENAME=${INPUT_FILENAME%.*}

dd if="$INPUT_FILENAME" of="$OUTPUT_FILENAME.mp4" bs=$(($FILESIZE-$MICRO_VIDEO_OFFSET)) skip="1"

Essentially, we use exiftools to determine the Micro Video Offset value and subtract that from the filesize to find the start of the video data, then use the dd utility to skip the photo and write the video data to a new file. Running the script over each of the 8 Motion Photo file results in 8 short videos showing the second or so before and after each photo was captured.

I watched each video frame-by-frame using VLC and soon found what I was looking for in MVIMG_20200307_130326.jpg

MVIMG_20200307_130326.jpg

This photo was taken on the road approaching Oslo Airport, and moving through the embedded video frame-by-frame we can see a road sign directing cargo traffic via exit E (or maybe F) 16.

I could have used Google Maps and Streetview as before to confirm the answer, but I had two attempts left so tried E16 first, which was accepted. Week 3 Done!

Flag

E16