Magnet Virtual Summit 2020 CTF – Memory Analysis Write-up

The Magnet Virtual Summit ran throughout May 2020 and included a CTF created in association with the Champlain College Digital Forensics Association. The CTF included Android, Apple iOS, Windows host, and Windows memory analysis challenges. Unfortunately I didn’t have as much time to spend on the CTF as I had hoped while the challenge was live so this write-up only covers the Windows memory analysis, as this is an area I have been focusing on recently.

The MVS is over and the CTF is no-longer available to the public, but the presentation videos are available to watch via the Magnet Forensics site.

Let’s get on with the analysis.

MD5: 224f93209cbea29e862890f30dfa762d
SHA1: 55f0d288c91296621e9d9f50a9d8ecf81d4e3148

01 – How’s Your Memory?

Which memory profile best fits the system?

This is generally the first thing you will need to work out when given a memory image to examine. We can use Volatility’s imageinfo or kdbgscan plugins to determine which profile best fits our image, I tend to use imageinfo.

vol.py -f memdump.mem imageinfo

The imageinfo plugin gives us a number of suggestions, but the profile Win7SP1x64 seems a sensible choice.

Flag: Win7SP1x64

02 – Hash Slinging

What is the LM hash of the user’s account?

Now that we have determined which profile to use we can get on with the rest of the analysis. Volatility has a hashdump module which, unsurprisingly, dumps hashes from the SAM registry hive.

vol.py -f memdump.mem --profile=Win7SP1x64 hashdump

The question doesn’t actually specify the username, but as there is only one user account other than the default Administrator and Guest accounts, we can be pretty sure the Warren account is the one we are after. NTLM hashes are stored in the format:

<username>:<rid>:<LM hash>:<NT hash>

As the question asks specifically for the LM hash, our flag is:

Flag: aad3b435b51404eeaad3b435b51404ee

03 – Cache Money

What is Warren’s Ignition Casino password? (Case Sensitive!!!!)

I found this question the hardest one in the section and undoubtedly spent the most time on it. I started by running the pstree plugin to get an overview of what processes were running when the memory image was captured.

vol.py -f memdump.mem --profile=Win7SP1x64 pstree

The first process I looked into was WINWORD.EXE (PID: 3180) in the hope that the user had typed the password into a document, but unfortunately this was a red-herring. Next I moved on to the web browsers, starting with Chrome.

If allowed by the user, Chrome will store login details for websites so that they can be auto-filled on subsequent visits. The passwords themselves are encrypted, but even if we can’t decrypt them we might get something useful from the database. The first thing to do is use the filescan plugin to output a list of files and their offsets within the memory image. I expected to use this output a lot for later questions, so I redirected the Volatility output to a file to speed up searching later on.

vol.py -f memdump.mem --profile=Win7SP1x64 filescan > filescan.txt

Chrome stores the login data in a SQLite database called Login Data under the user’s local profile. Using grep to filter the filescan output we can quickly find the database offset and extract it using the dumpfiles plugin.

grep -i '\\Device\\HarddiskVolume1\\Users\\Warren\\AppData\\Local\\Google\\Chrome\\User Data\\Default\\Login Data' filescan.txt
vol.py -f memdump.mem --profile=Win7SP1x64 dumpfiles -Q 0x000000013fa8cf20 -D .

Now that we have extracted the Login Data database we can open it up in a SQLite browser and take a look.

Record 3 contains the data for the Ignition Casino website. We can clearly see the stored email address (warrenhamiltonfinance[@]gmail[.]com) but, as expected, the password is encrypted.

763130335e48e70e4dcc9512f02f3e25e174dace6ef49afa1ca6103326faf4cd624e4579647548d40f04

Having done some digging into Chrome’s password storage mechanism it is likely that they can be decrypted using data we have in the memory dump, however as I had limited time available I opted for the less elegant approach of running strings over the memory image and heavily relying on grep! We were able to confirm the email address that Warren used, giving us our first filter. Searching these lines for casino seems reasonable.

strings memdump.mem | grep -i 'warrenhamiltonfinance@gmail.com' | grep -i 'casino'

There we go! That looks enough like a password that it is worth submitting, and it turns out to be correct.

Flag: WHbigboy123

04 – Never Tell Me The Odds…

It seems like Warren may have let his addictions slip into his work life… Find the program in question, recover it from memory, and give the SHA1 hash

We need to find the Ignition Casino executable and calculate its SHA1 hash. There is nothing obviously related to Ignition Casino in the pstree output, but we can check the filescan output for clues.

grep -i 'casino' filescan.txt
vol.py -f memdump.mem --profile=Win7SP1x64 dumpfiles -Q 0x000000013d5f4070 -D .
sha1sum file.None.0xfffffa80339f4650.img

Our grep search only gives us one hit, but it looks like a plausible location for the application to have been installed. Again, we can use the dumpfiles plugin to extract the executable, then calculate the SHA1 hash.

Flag: 3b7ca3bb8d4fb2b6c287d6a247efd7c457937a3e

05 – Compilation Station

When was IgnitionCasino.exe compiled? YYYY-MM-DD HH:MM:SS

Now that we have the executable, we move away from memory analysis for a little bit to examine the executable itself. There are number of different tools to examine PE files, but I have pev installed on my SIFT VM, and that is enough for what we need to find here. I used grep to clean-up the output.

pev file.None.0xfffffa80339f4650.img | grep 'Date/time stamp:'

We can see the compilation date and time. Converting it to the YY-MM-DD HH:MM:SS format required by the question, we get our final flag.

Flag: 2020-02-12 12:01:35

13Cubed Mini Memory CTF Write-up

At the beginning of March 2020 Richard Davis published a small memory forensics CTF challenge to his 13Cubed Youtube channel, with four questions and the generous prize of a Nintendo Switch Lite for a randomly selected entrant with all four correct flags. Well, I didn’t win, but I did have a lot of fun digging into the memory image. And as Richard has published his official solution I thought I’d show my working as well.

We start off as usual by downloading the memory dump and calculating some hashes.

MD5: f3cc405eaf4e63cb9c4b4986c86a7016
SHA1: 7d2b7802b87da03c5e96f159d0bc7ba29896a07c

Before we can dig any deeper into the image we need to tell Volatility which profile to use by running the imageinfo plugin.

vol.py -f memdump.mem imageinfo

We are offered a few possibilities but Win10x64_17134 seems sensible enough for now. On with the challenge!

Flag 1

Find the running rogue (malicious) process. The flag is the MD5 hash of its PID.

There are a few different plugins which will show us information about processes; my favourite is pstree as it makes spotting parent/child relationships much easier.

vol.py -f memdump.mem --profile=Win10x64_17134 pstree

We have a lot of running processes! Things get more interesting after scrolling down a bit further.

There are a number of processes named svchost.exe running under explorer.exe – this should never happen with a legitimate svchost.exe process! Let’s dig a bit deeper with pstree, using grep to show the column headers, and filter out the svchost.exe processes with a Parent Process ID of 4824 (explorer.exe)

vol.py -f memdump.mem --profile=Win10x64_17134 pstree | grep -E "^Name|svchost" | grep -E "^Name|4824"

The question specified a running process; 8560 looks a likely candidate given it is the only one that has any threads attached, but let’s use the psscan plugin to confirm.

vol.py -f memdump.mem --profile=Win10x64_17134 psscan | grep -E "^Offset|svchost" | grep -E "^Offset|4824"

As the screenshot above shows, all the candidate process have an exit time except for 8560, suggesting it is our running rogue process. Calculate the MD5 hash of the PID and we have our first flag.

echo -n 8560 | md5sum
bc05ca60f2f0d67d0525f41d1d8f8717

Flag 2

Find the running rogue (malicious) process and dump its memory to disk. You’ll find the 32 character flag within that process’s memory.

We start by dumping the memory of our rogue process to disk, and extracting the human-readable strings.

vol.py -f memdump.mem --profile=Win10x64_17134 memdump -p 8560 -D .
strings memdump.mem > 8560.dmp.strings

Easy so far. Unfortunately our output file contains almost 24 million lines (23,912,252 to be exact). We know the flag is 32 characters long, so let’s run strings again and specify that only lines with 32 characters or more should be extracted, then run those through sort and uniq to remove any duplicates.

strings -n 32 8560.dmp.strings | sort | uniq > 8560.dmp.strings.32

That’s a big reduction but still leaves 491,446 lines to search through. Sadly, with no idea what the flag looked like, I wasn’t able to find a more elegant way of filtering it out so resorted to paging through the file using less until I found something interesting.

"contents": "da391kdasdaadsssssss t.h.e. fl.ag.is. M2ExOTY5N2YyOTA5NWJjMjg5YTk2ZTQ1MDQ2Nzk2ODA=",

The last part of the string is longer than 32 characters, and looks like base64; let’s decode it and find the second flag.

echo -n M2ExOTY5N2YyOTA5NWJjMjg5YTk2ZTQ1MDQ2Nzk2ODA= | base64 -d
3a19697f29095bc289a96e4504679680

Flag 3

What is the MAC address of this machine’s default gateway? The flag is the MD5 hash of that MAC address in uppercase with dashes (-) as delimiters. Example: 01-00-A4-FB-AF-C2.

This question incorporates a bit of Windows host-based forensics knowledge. Details of the host’s network connections are held in the SOFTWARE registry hive, under the following key:

Microsoft\Windows NT\CurrentVersion\NetworkList\Signatures\Unmanaged

We can use Volatility to query the registry hives in memory using the printkey plugin; by default printkey will search through all available registry hives in the memory image, but we can be a bit more precise and use the hivelist plugin to find the address of the SOFTWARE hive rather than brute-forcing it.

vol.py -f memdump.mem --profile=Win10x64_17134 hivelist

The hivelist plugin completes and tells us the virtual address of the SOFTWARE hive is 0xffffd38985eb3000. Now to use printkey to query the registry itself. The network data sits under a randomly generated sub-key; we will need to determine that before getting the data we are after.

vol.py -f memdump.mem --profile=Win10x64_17134 printkey -o "0xffffd38985eb3000" -K "Microsoft\Windows NT\CurrentVersion\NetworkList\Signatures\Unmanaged"

Luckily there is only one sub-key, making the task easier.

010103000F0000F0080000000F0000F0E3E937A4D0CD0A314266D2986CB7DED5D8B43B828FEEDCEFFD6DE7141DC1D15D

Running printkey again with our newly discovered path gives us our network data.

vol.py -f memdump.mem --profile=Win10x64_17134 printkey -o "0xffffd38985eb3000" -K "Microsoft\Windows NT\CurrentVersion\NetworkList\Signatures\Unmanaged\010103000F0000F0080000000F0000F0E3E937A4D0CD0A314266D2986CB7DED5D8B43B828FEEDCEFFD6DE7141DC1D15D"

The MAC address of the default gateway is at the bottom of the output under DefaultGatewayMac. The question asks for the answer as the MD5 hash of the upper-case MAC address, with dashes as delimiters. Sounds like a task for CyberChef!

There we go. Flag three:

6496d43b622a2ad241b4d08699320f4e

Flag 4

Find the full path of the browser cache created when an analyst visited http://www.13cubed.com. The path will begin with “Users\.” Convert the path to uppercase. The flag is the MD5 hash of that string.

This one was relatively straightforward. We need to find a filepath created when www.13cubed.com was visited in a web browser. The question tells us that the path begins with “Users\” and we can assume that it contains the string “13cubed” as well. I first tried the filescan plugin to check for relevant file objects in memory, but this did not give me any meaningful results.

I tried again using the mftparser plugin which, perhaps obviously, parses the Master File Table combined with grep to filter on the string “13cubed

vol.py -f memdump.mem --profile=Win10x64_17134 mftparser | grep -i "13cubed"

This gives two results, one HTML file and one PNG image. As we are looking for a web browser artefact I went with the path of the HTML file:

Users\CTF\AppData\Local\Packages\MICROS~1.MIC\AC\#!001\MICROS~1\Cache\AHF2COV9\13cubed[1].htm

We need to convert this to upper-case and calculate the MD5 hash to get the flag; back to CyberChef.

Final flag – done.

b5bdd048030cd26ab2d0e7f7e351224d

I didn’t win the Nintendo Switch but had a huge amount of fun working through the challenge, especially working on registry analysis via the memory image. I would encourage anyone reading this who wants to improve their forensics and incident response skills to subscribe to the 13Cubed Youtube channel, and I hope that Richard finds the time to put more challenges together in the future!

Defcon 2019 DFIR CTF – Memory Forensics Write-up

In an effort to improve my forensics skills I have been working through publicly available forensics CTFs when I have some free time.

The 2019 Unofficial Defcon DFIR CTF was created by the Champlain College Digital Forensics Association and made public by David Cowen on his Hacking Exposed Computer Forensics blog. The CTF covers Windows and Linux “dead” forensics, a “live” triage VM, memory forensics, and a cryptography challenge. This write-up focuses on the memory forensics questions.

Links to the CTF files and registration/scoreboard can be found on this HECF blog post.

The following MD5 hash was provided for the Triage-Memory.mem file:

MD5: c0c80a06ad336a6e20d42c895a0e067f

Let’s get started!

flag 1 – get your volatility on

We begin with a straightforward one; calculate the SHA1 hash of the memory image.

sha1sum Triage-Memory.mem

flag<c95e8cc8c946f95a109ea8e47a6800de10a27abd>

flag 2 – pr0file

Again, reasonably simple. We need to work out which profile to use with Volatility to conduct our analysis. The imageinfo plugin will suggest a number of suitable candidates.

vol.py -f Triage-Memory.mem imageinfo

The output lists a few possibilities, but Win7SP1x64 is a sensible choice for now.

flag<Win7SP1x64>

flag 3 – hey, write this down

There are a few Volatility modules we can use to list running process IDs. My personal preference is pstree just because it makes the parent/child relationship more obvious, which can help to spot anything unusual.

vol.py -f Triage-Memory.mem --profile=Win7SP1x64 pstree

We are looking specifically for notepad.exe so we can cut out a lot of the unrelated output using grep

vol.py -f Triage-Memory.mem --profile=Win7SP1x64 pstree | grep -i "notepad.exe"

Using grep to filter the output we can easily see that the PID is 3032.

flag<3032>

flag 4 – wscript can haz children

We already have the answer to this from the pstree output in Flag 3, but using grep as a filter will make it easier to spot. The -A 2 option tells grep to display the matching line and the 2 lines that follow it.

vol.py -f Triage-Memory.mem --profile=Win7SP1x64 pstree | grep -A 2 -i "wscript.exe"

The output shows that wscript.exe has one child process, UWkpjFjDzM.exe, which itself has a child process called cmd.exe; a good indication that something is wrong there.

flag<UWkpjFjDzM.exe>

flag 5 – tcpip settings

The question asks for the IP address of the machine when the memory dump was taken. The netscan plugin will show details of network artefacts captured in the memory dump.

vol.py -f Triage-Memory.mem --profile=Win7SP1x64 netscan

The question asks for the IP address of the machine at the time of the memory dump. We can see processes listening on addresses 0.0.0.0 and 127.0.0.1, which are unlikely to be our flag, and 10.0.0.101 which is a much more likely. Another interesting observation is that our process from Flag 4 is connecting to another machine on port 4444 – the default port for many Metasploit payloads. Keep that in mind for later.

flag<10.0.0.101>

flag 6 – intel

Based on our work to find Flag 4 and Flag 5, we can answer this quite easily. Let’s examine the netscan output more closely.

vol.py -f Triage-Memory.mem --profile=Win7SP1x64 netscan | grep "UWkpjFjDzM.exe"

We can see our “infected” process UWkpjFjDzM.exe connecting to 10.0.0.106 on port 4444.

flag<10.0.0.106>

flag 7 – i ❤ windows dependencies

As the name suggests, the dlllist plugin will list the DLLs loaded by each process. This is a lot of output, so to find the answer I used grep with increasing values for the -B option to show the associated process. Not very subtle but it worked!

vol.py -f Triage-Memory.mem --profile=Win7SP1x64 dlllist | grep -B 33 "VCRUNTIME140.dll"

There we are! Initially I submitted OfficeClickToRun.exe as the flag, but when that was rejected I tried the short name (OfficeClickToR) next to the Process ID near the top of the output.

flag<OfficeClickToR>

flag 8 – mal-ware-are-you

Ok, we have already identified our potential malware from Flags 4, 5, and 6. So take its PID (3496) and dump the executable using the procdump plugin, then calculate the MD5 of the extracted binary.

vol.py -f Triage-Memory.mem --profile=Win7SP1x64 procdump -p 3496 -D .
md5sum executable.3496.exe

flag<690ea20bc3bdfb328e23005d9a80c290>

flag 9 – lm-get bobs hash

Another relatively simple one. The hashdump plugin will, predictably, dump the password hashes from memory.

vol.py -f Triage-Memory.mem --profile=Win7SP1x64 hashdump

We need to supply the LM hash, which is the first portion of the hash after Bob’s user ID (1000)…

flag<aad3b435b51404eeaad3b435b51404ee>

flag 10 – vad the impaler

Information on VAD nodes can be extracted using the vadinfo plugin. It outputs a lot of data, so for ease of reading I’ve used grep to focus on the lines we are interested in.

vol.py -f Triage-Memory.mem --profile=Win7SP1x64 vadinfo | grep -A 2 "0xfffffa800577ba10"

We can see the VAD node at offset 0xfffffa800577ba10 has the PAGE_READONLY protection. That’s our flag.

flag<PAGE_READONLY>

11 – more vads?!

This is essentially the same question as Flag 10, just with a bit of extra grep. Instead of filtering on the starting offset, we filter on both start and end.

vol.py -f Triage-Memory.mem --profile=Win7SP1x64 vadinfo | grep -A 2 "Start 0x00000000033c0000 End 0x00000000033dffff"

This time the protection is PAGE_NOACCESS.

flag<PAGE_NOACCESS>

flag 12 – vacation bible school

We are looking for a VBS script now. There are a few ways we could do this but the easiest is simply to check the command-line used to start the wscript.exe process that we observed in the pstree output for Flag 4. We know the wscript.exe PID is 5116, so we can pass that to the cmdline plugin to reduce the reading we have to do.

vol.py -f Triage-Memory.mem --profile=Win7SP1x64 cmdline -p 5116

We can see that wscript.exe was called with a script called vhjReUDEuumrX.vbs from the %TEMP% directory. Strip the extension and we have our flag.

flag<vhjReUDEuumrX>

flag 13 – thx microsoft

The Application Compatibility Cache (or shimcache) contains details of program execution and can be parsed using the shimcache plugin. We are looking for an application executed at a specified date and time, so we can use grep to filter the output.

vol.py -f Triage-Memory.mem --profile=Win7SP1x64 shimcache | grep "2019-03-07 23:06:58"

This time we need to include the file extension.

flag<Skype.exe>

flag 14 – lightbulb moment

Extracting the text from a running notepad.exe process is relatively straightforward but does require a couple of steps. First we need to dump the process memory using the memdump plugin; we found the PID for notepad.exe in Flag 3 (3032). The next step is to use the strings utility to extract all of the human-readable little-endian strings and write them to a file.

vol.py -f Triage-Memory.mem --profile=Win7SP1x64 memdump -p 3032 -D .
strings -e l 3032.dmp > 3032.dmp.strings

Once we have our strings output we can use grep to search for our flag. The word “flag” seems a reasonable place to start.

grep "flag" 3032.dmp.strings

There we go!

flag<REDBULL_IS_LIFE>

flag 15 – 8675309

Details about file records are held in the Master File Table (MFT) and can be extracted from the memory dump using the mftparser plugin. We are specifically looking for the Short Name of the file at record 59045; once again, grep will help us here.

vol.py -f Triage-Memory.mem --profile=Win7SP1x64 mftparser | grep -A 20 "59045"

Reading through the output we can see the 8.3 short file name EMPLOY~1.XLS.

flag<EMPLOY~1.XLS>

flag 16 – whats-a-metasploit?

We can be pretty sure that UWkpjFjDzM.exe (PID: 3496) is our Meterpreter process, given what we found out answering Flag 4, 5, and 6, but let’s make sure. First we dump the process executable using the procdump module, then calculate its SHA1 hash so we can search public sandboxes like VirusTotal.

vol.py -f Triage-Memory.mem --profile=Win7SP1x64 procdump -p 3496 -D .
sha1sum executable.3496.exe

Searching VirusTotal for the SHA1 hash (ab120a232492dcfe8ff49e13f5720f63f0545dc2) gives us a report clearly showing that the sample is malicious.

We submit the process ID (3496) and we have completed the memory analysis section!

flag<3496>

This is a really well put together set of challenges, and when I have more time I will probably return to take on the Windows and Linux challenges as well.

Memlabs Memory Forensics Challenges – Lab 1 Write-up

In an effort to improve my forensics skills I have been working through publicly available forensics CTFs when I have some free time.

Memlabs is a set of six CTF-style memory forensics challenges released in January 2020 by @_abhiramkumar and Team bi0s. This write-up covers the first memory image which has three flags to uncover.

Unlike most CTFs I have encountered, Memlabs does not actually ask any questions or give hints regarding the flags, only that the flags have the following format:

flag{stage1_is_n0w_d0n3}

No hashes were provided to check against but I calculated the following:

MD5: b9fec1a443907d870cb32b048bda9380
SHA1: 02a58ccf572e6b369934268842551722c4411a60

Let’s go!

Flag 1

First let’s determine what kind of memory image we are working with. As usual for memory forensics, I’m going to work with Volatility.

vol.py -f MemoryDump_Lab1.raw imageinfo

The first suggestion is Win7SP1x64; this seems like a sensible starting point.

We have no clues as to what we are supposed to be looking for. Let’s check the running processes using the pstree module and see if anything stands out.

vol.py -f MemoryDump_Lab1.raw --profile Win7SP1x64 pstree

The only processes that stand out are WinRAR.exe (PID: 1512), cmd.exe (PID: 1984), and mspaint.exe (PID: 2424). DumpIt.exe is likely the tool used to capture the memory dump so I am ignoring it for now. We can use the cmdline and consoles modules to show the command that launched these processes, and any console output associated with them.

vol.py -f MemoryDump_Lab1.raw --profile Win7SP1x64 cmdline -p 1512,1984,2424
vol.py -f MemoryDump_Lab1.raw --profile Win7SP1x64 consoles

The output from cmdline tells us that WinRAR.exe was launched with a file called Important.exe which seems, well, important but the consoles plugin shows a command St4Ge$1 being run and the following output:

ZmxhZ3t0aDFzXzFzX3RoM18xc3Rfc3Q0ZzMhIX0=

Decoding this from base64 gives us our first flag:

echo "ZmxhZ3t0aDFzXzFzX3RoM18xc3Rfc3Q0ZzMhIX0=" | base64 -d

flag{th1s_1s_th3_1st_st4g3!!}

Flag 2

I actually found Flag 3 before Flag 2 as I spotted the reference to Important.rar in the cmdline output, but for ease of reading I’ll keep this order. As I had examined the cmd.exe and WinRAR.exe processes already I guessed that Flag 2 was hidden in the mspaint.exe process, so began by dumping the process memory.

vol.py -f MemoryDump_Lab1.raw --profile Win7SP1x64 memdump -p 2424 -D .

After some Googling I found a blogpost detailing how to extract RAW images from memory dumps. I renamed the dump from 2424.dmp to 2424.data and opened it up with the GIMP image editing suite, setting the Image Type to RGB Alpha, and fiddling with the Offset, Width, and Height values through trial and error until I got something that looked intelligible.

That’s definitely text but not very easy to read. I’m better with Volatility than with GIMP so I took a screenshot of the image preview and flipped it vertically, revealing the flag.

flag{G00d_BoY_good_girL}

Flag 3

The output from the cmdline module showed that WinRAR.exe had been launched with a file called Important.rar. Lets extract that from the memory image and take a look.

vol.py -f MemoryDump_Lab1.raw --profile Win7SP1x64 filescan | grep -i "important.rar"
vol.py -f MemoryDump_Lab1.raw --profile Win7SP1x64 dumpfiles -Q 0x000000003fa3ebc0 -D .
file file.None.0xfffffa8001034450.dat

I renamed the file to Important.rar and tried extracting the contents.

unrar x Important.rar

Unfortunately we need a password. Fortunately the password hint tells us where to find it. We can use the hashdump module to dump the NTLM hashes.

vol.py -f MemoryDump_Lab1.raw --profile Win7SP1x64 hashdump

We only need the second part of the hash, but we do need to convert it to upper-case first. Rather than doing it manually I used CyberChef to do it for me.

Now we have the password we can extract the archive and view its contents – a PNG image containing our flag.


flag{w3ll_3rd_stage_was_easy}

Despite completing the first challenge I found the lack of direction or motivation incredibly frustrating. The whole point of forensic investigation is to follow a trail, building on what has been found already to come to a specified conclusion. Real investigations have a purpose. Why was this memory dump captured in the first place? Why are you asking me to take the time to do some analysis? I did learn a new technique in finding Flag 2, but for now I am skipping the rest of Memlabs to work on something more representative of real-world DFIR.

OtterCTF 2018 – Memory Forensics Write-up

In an effort to improve my forensics skills I have been working through publicly available forensics CTFs when I have some free time.

OtterCTF dates from December 2018 and includes reverse engineering, steganography, network traffic, and more traditional forensics challenges. This write-up only covers the memory forensics portion, but the whole CTF is available to play as of the publication of this post.

The first thing to do is download the memory image (OtterCTF.vmem). There weren’t any hashes published to check against, but I calculated the following:

MD5: ad51f4ada4151eab76f2dce8dea69868
SHA1: e6929ec61eb22af198186238bc916497e7c2b1d2

Let’s get on with it…

Question 1 – What the password?


Question 1 - you got a sample of rick's PC's memory. can you get his user password?

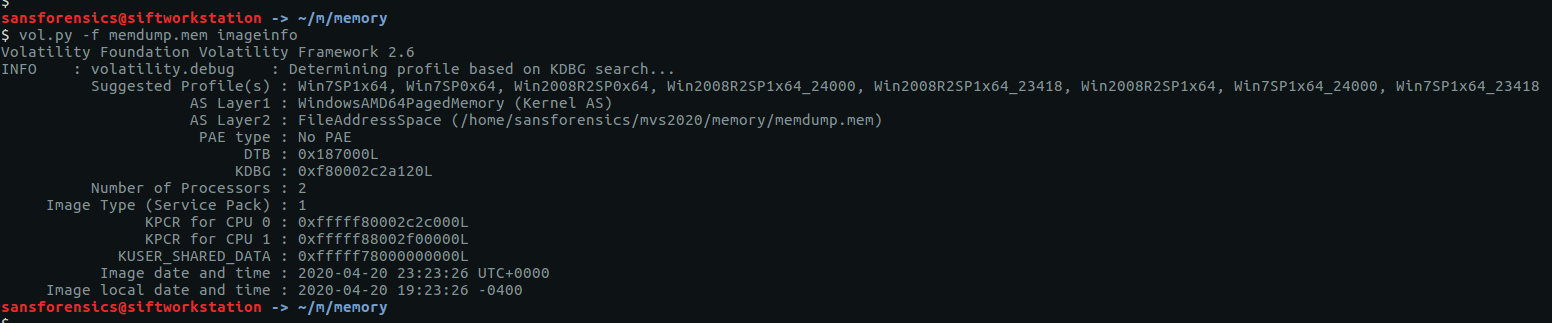
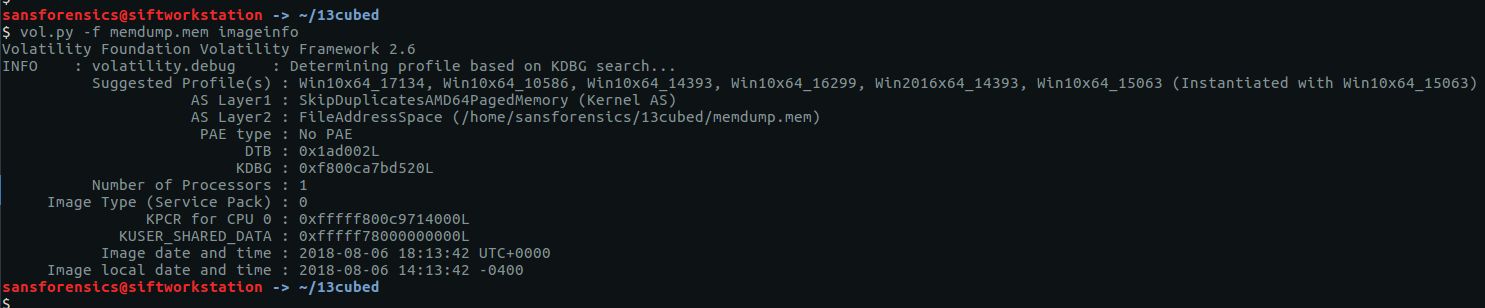
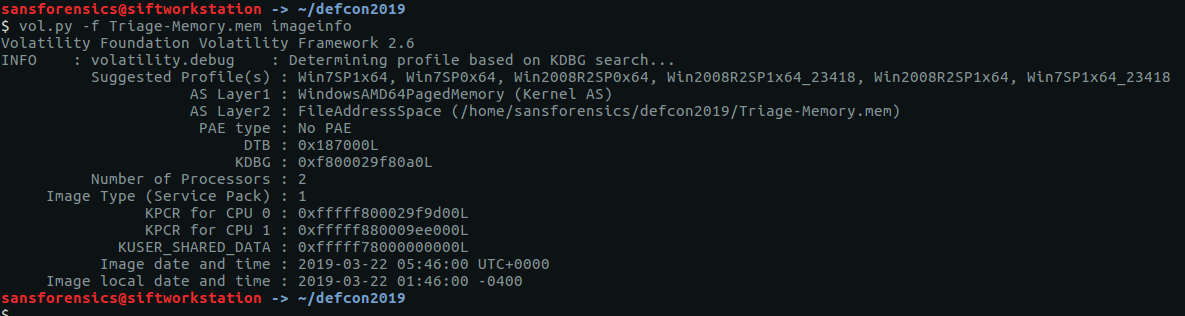
Before we can get started on analysis we need to tell Volatility what kind of memory image we are working with. The imageinfo plugin will scan the image and suggest a number of likely profiles.

vol.py -f OtterCTF.vmem imageinfo

The Win7SP1x64 profile seems like a sensible choice for now (we can always revisit this later if we run into errors). Onto the analysis!

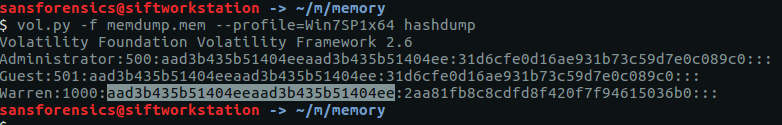
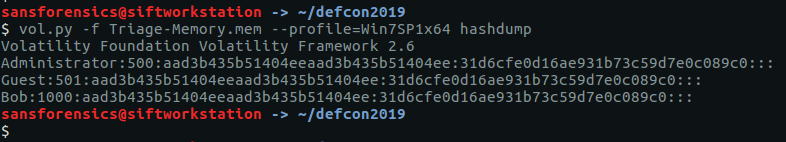
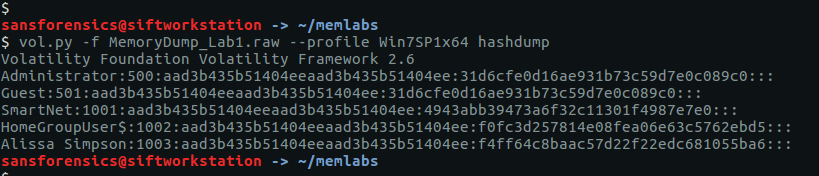
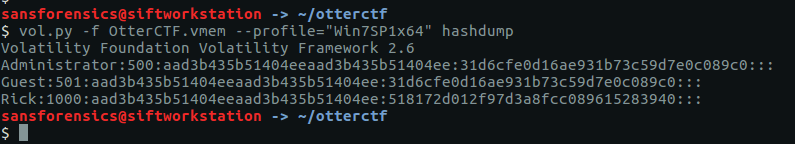
The hashdump plugin will, unsurprisingly, dump the NTLM hashes from the SYSTEM and SAM registry hives.

vol.py -f OtterCTF.vmem --profile="Win7SP1x64" hashdump

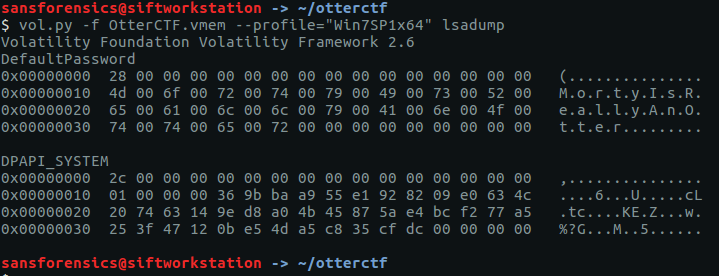
The question asks for the user password, not the password hash, so we can either try to crack this using tools like John the Ripper or Hashcat (or Google), or we can try extracting the plaintext password from the LSA secrets using the lsadump plugin.

vol.py -f OtterCTF.vmem --profile="Win7SP1x64" lsadump

And we have our first flag:

CTF{MortyIsReallyAnOtter}

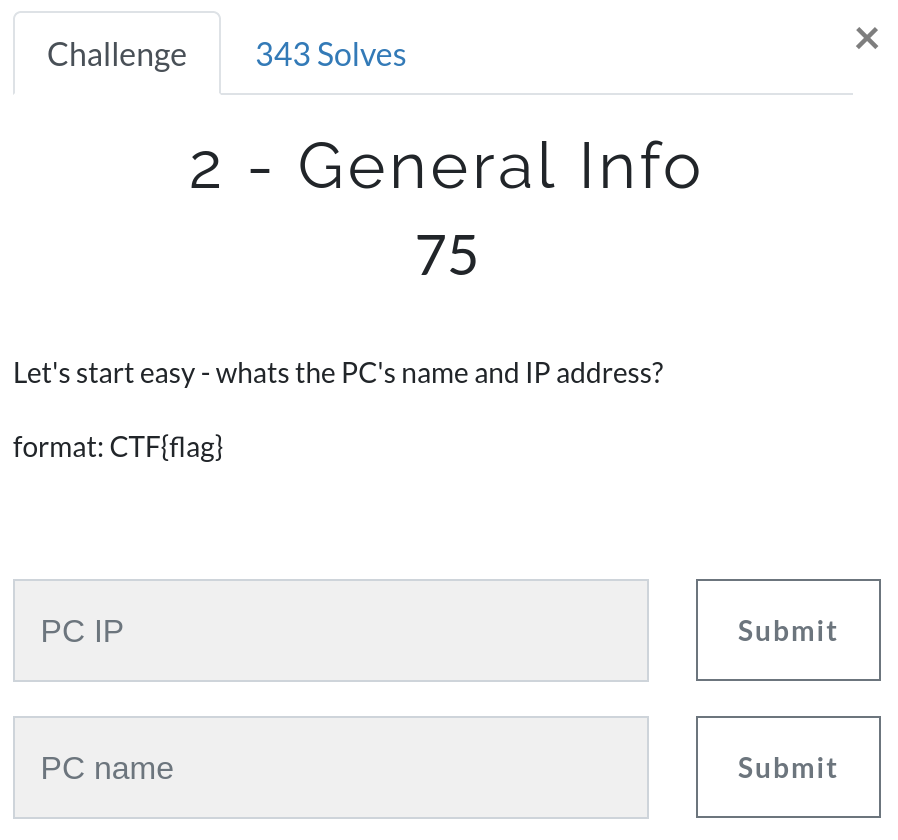
Question 2 – General Info

Question 2 - Let's start easy - whats the PC's name and IP address?

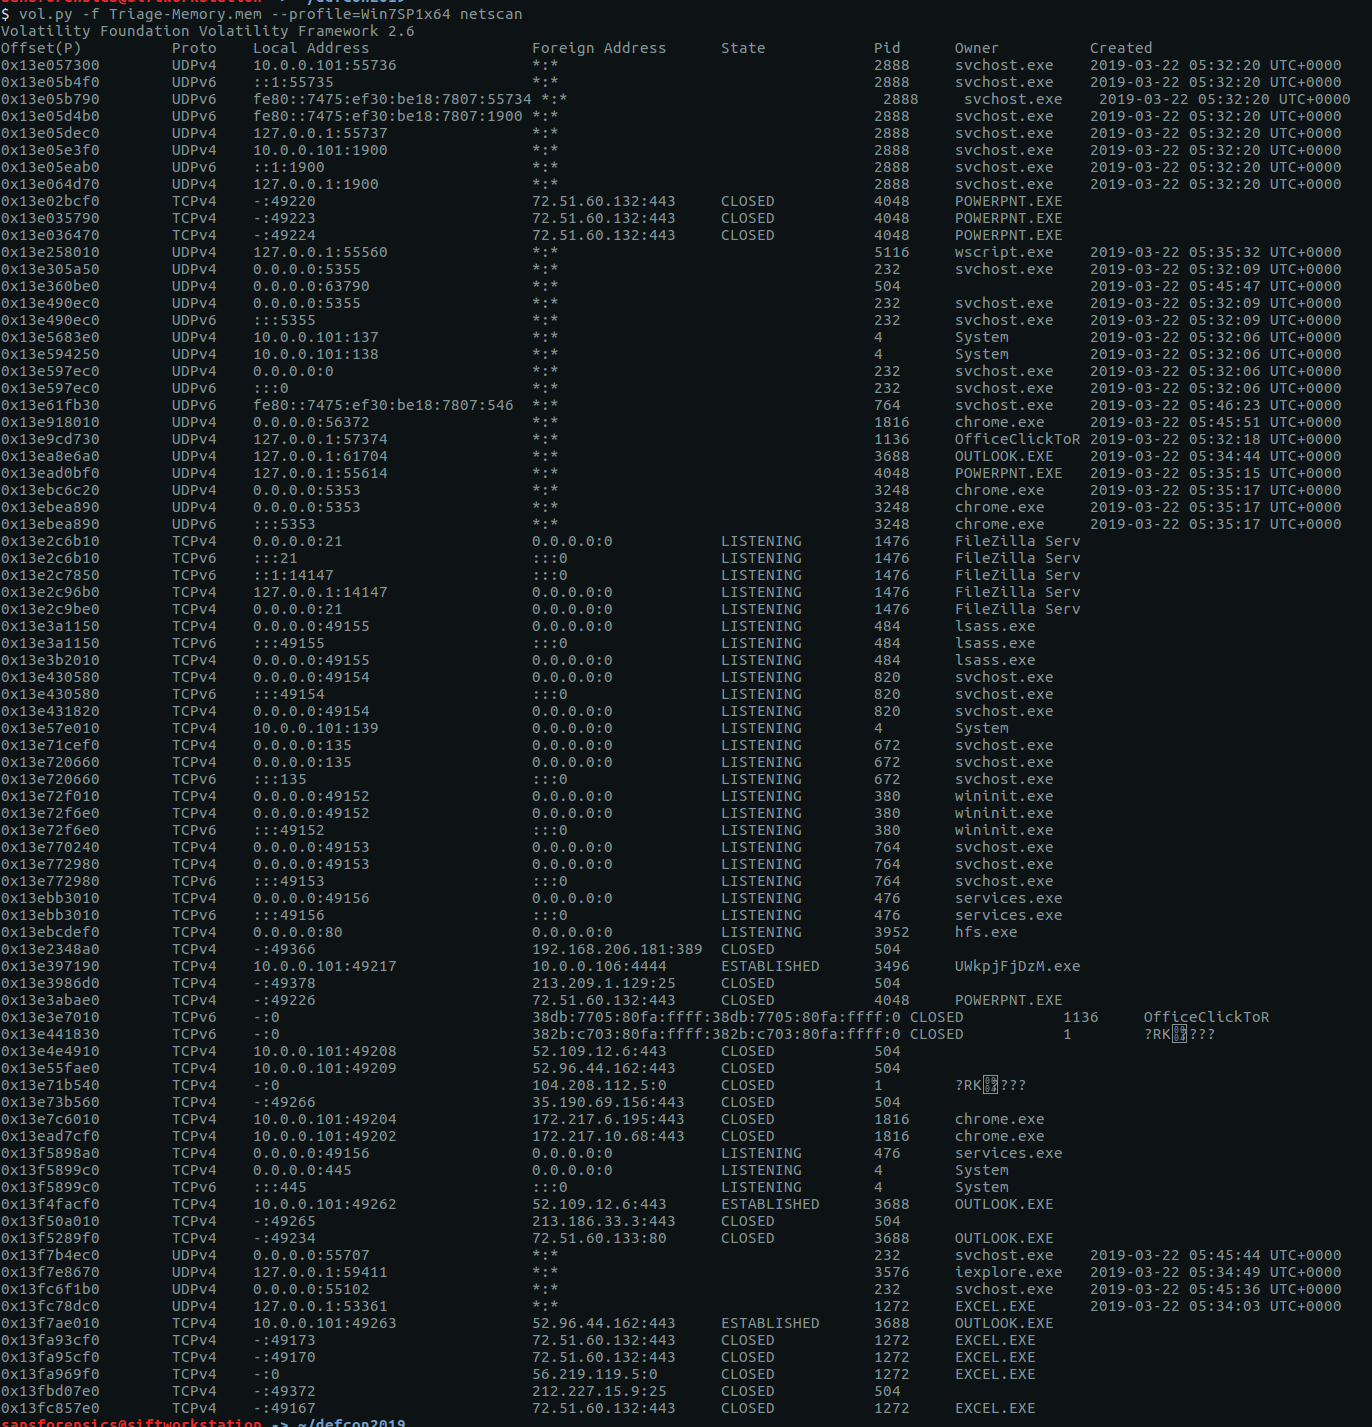
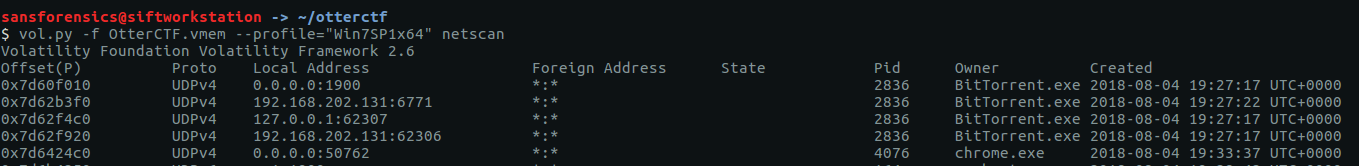
We need to find the IP address and hostname of Rick’s machine. The netscan plugin will give us the network data we need.

vol.py -f OtterCTF.vmem --profile="Win7SP1x64" netscan

We can rule out 0.0.0.0 and 127.0.0.1, leaving us with 192.168.202.131

CTF{192.168.202.131}

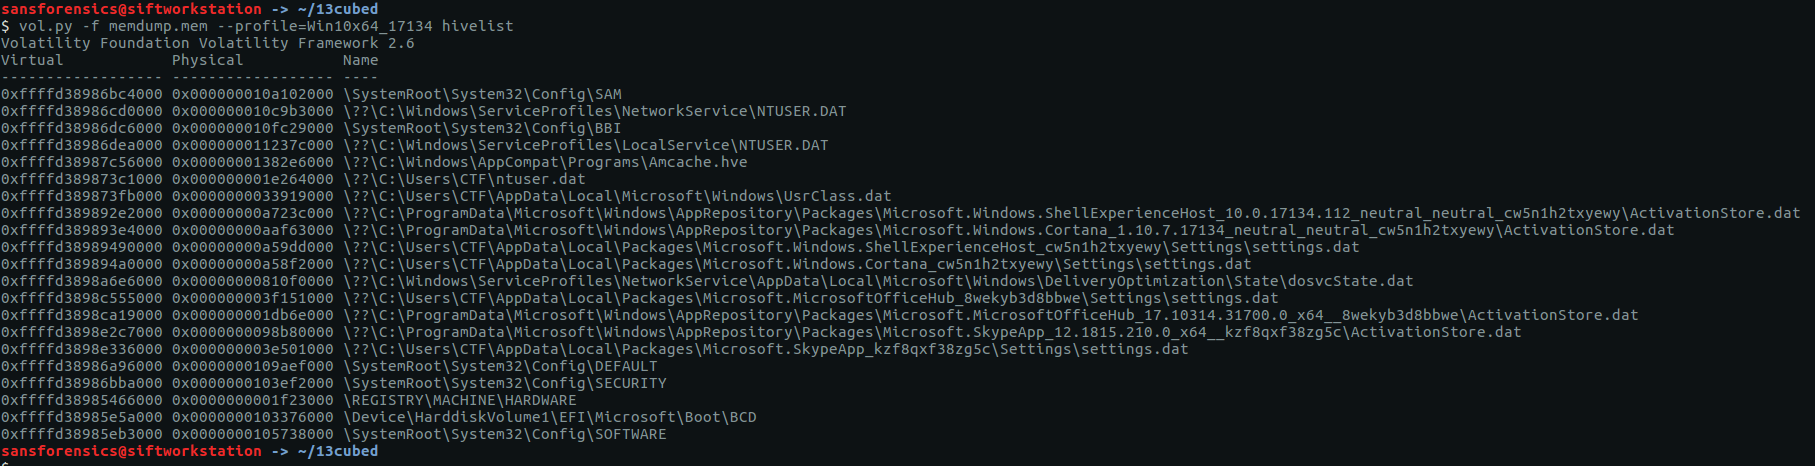
The hostname is stored in the SYSTEM registry hive. Before we can query the hive we need to find the offset.

vol.py -f OtterCTF.vmem --profile="Win7SP1x64" hivelist

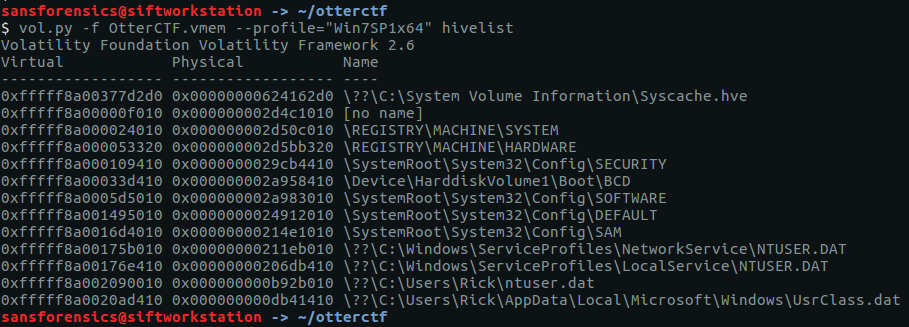
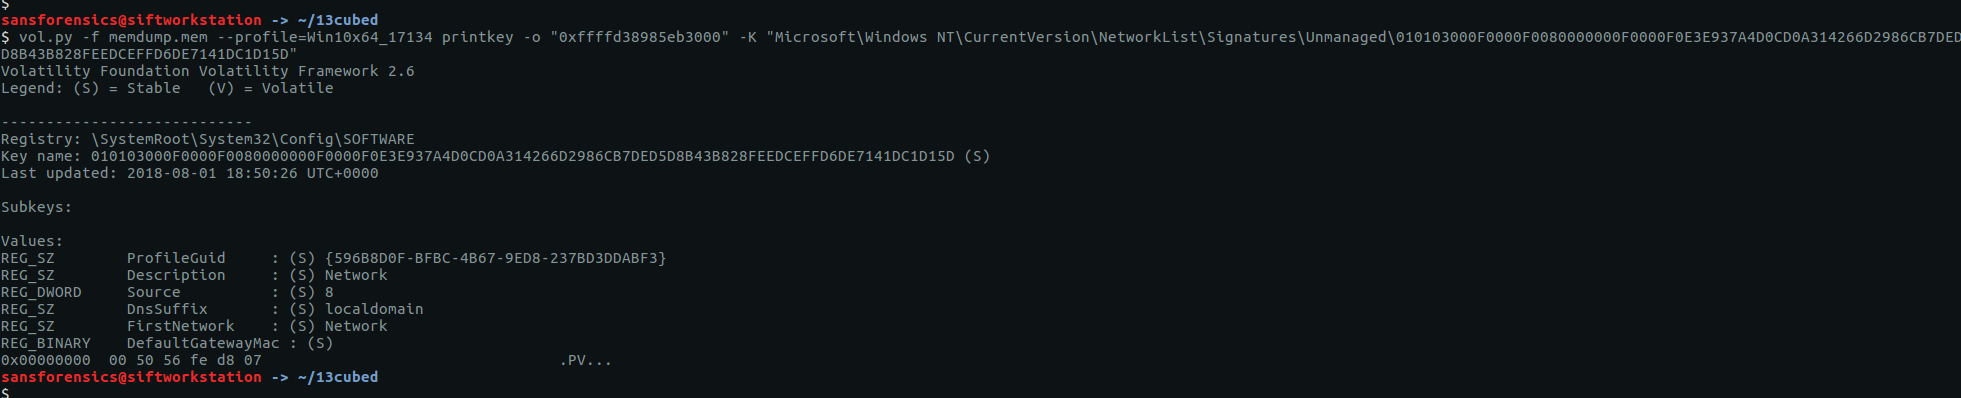
Supplying the printkey plugin with the offset and the name of the relevant registry key gives us the second flag for this question.

vol.py -f OtterCTF.vmem --profile="Win7SP1x64" printkey -o 0xfffff8a000024010 -K "ControlSet001\Control\ComputerName\ComputerName"

CTF{WIN-LO6FAF3DTFE}

Question 3 – Play Time

Question 3 - Rick just loves to play some good old videogames. can you tell which game is he playing? whats the IP address of the server?

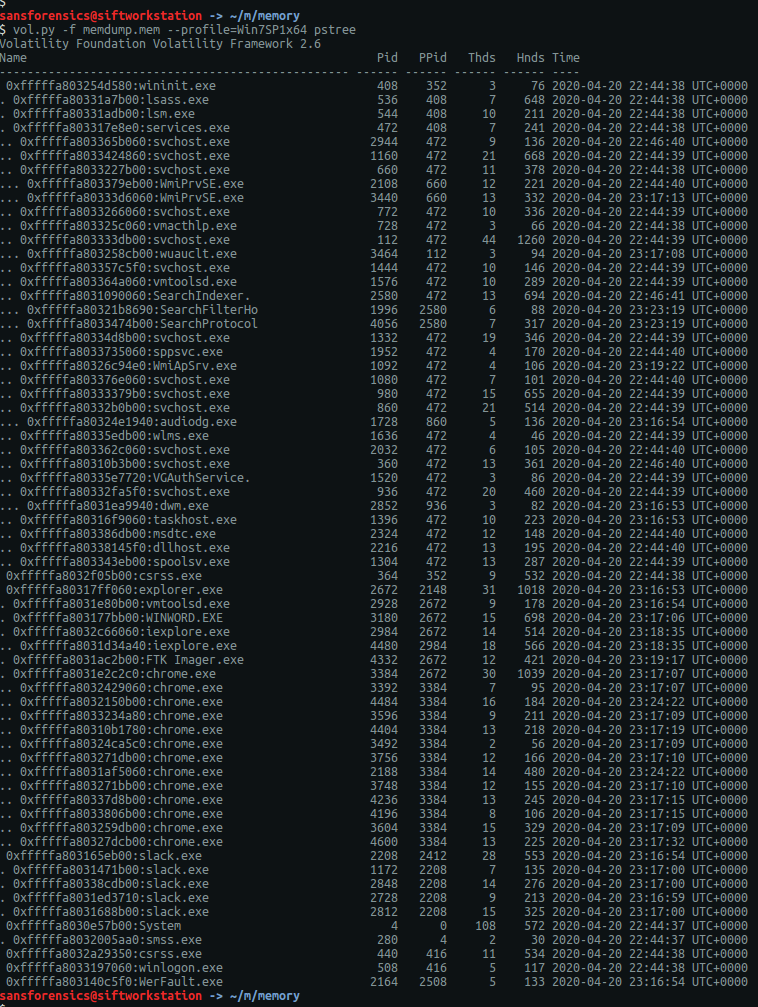
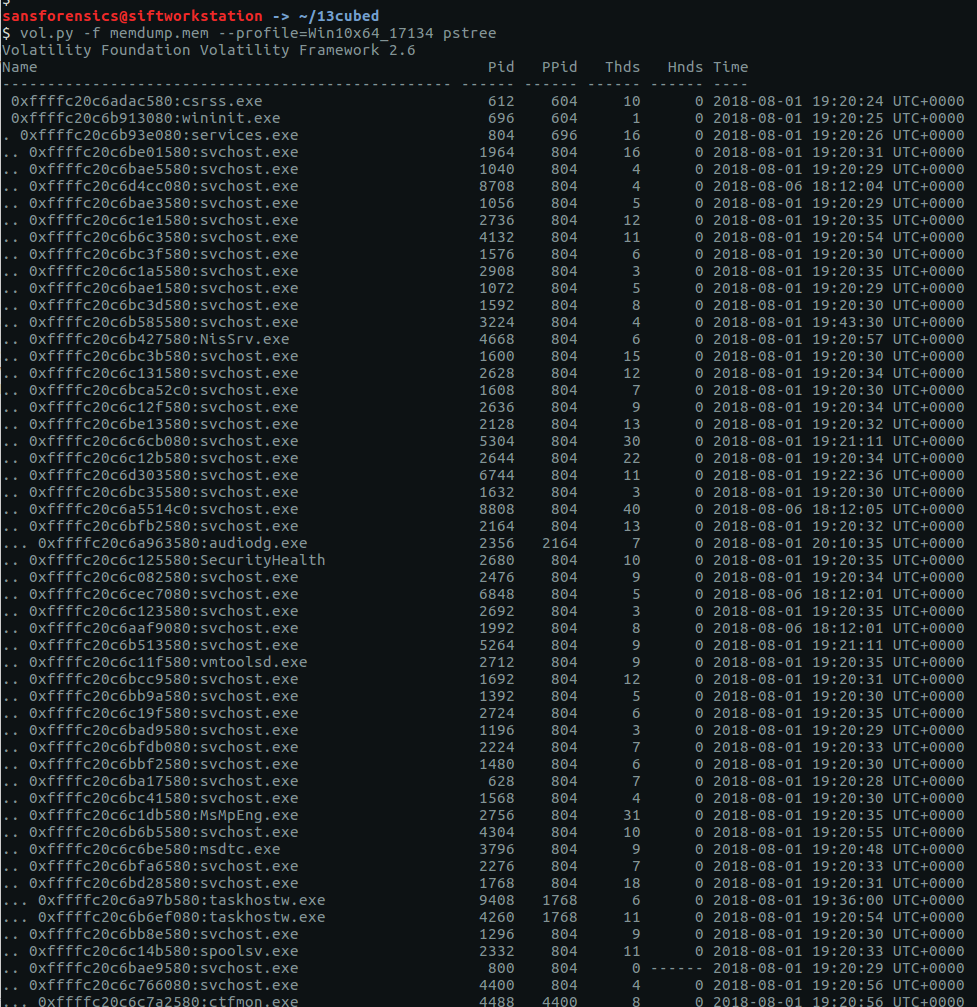
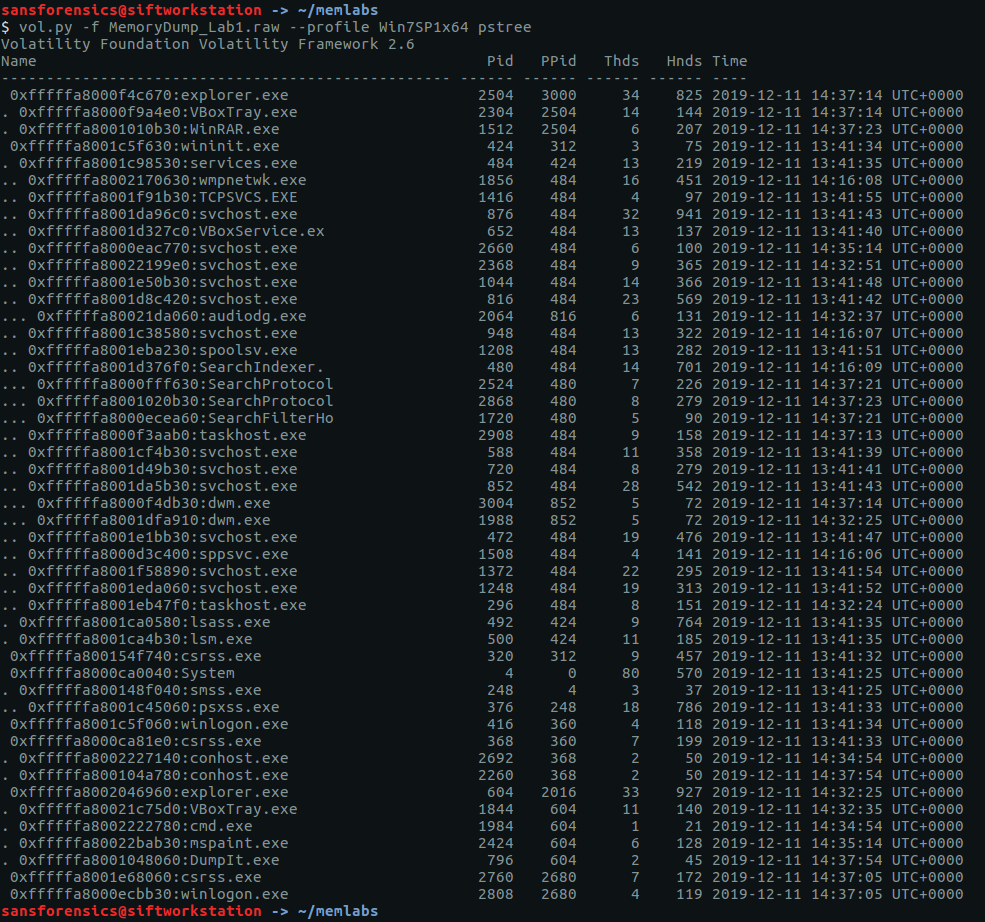
The pstree plugin gives us a nice view of running processes.

vol.py -f OtterCTF.vmem --profile="Win7SP1x64" pstree

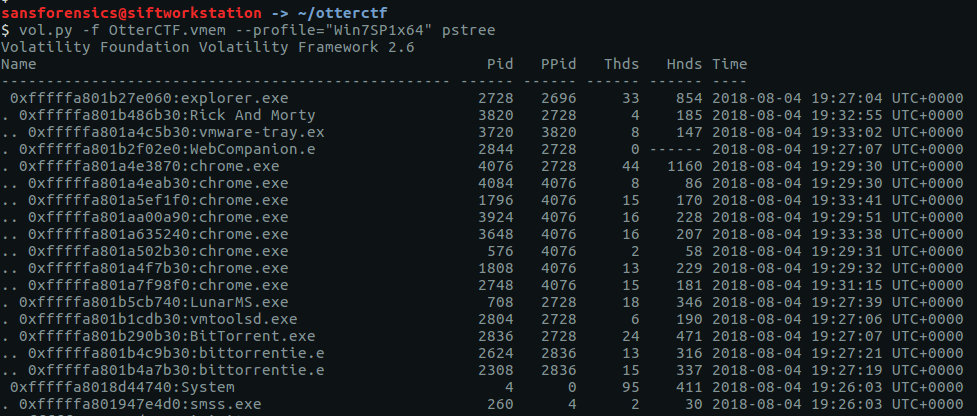
Google tells me that LunarMS is associated with an old MMORPG, so there’s the first part of our answer.

CTF{LunarMS}

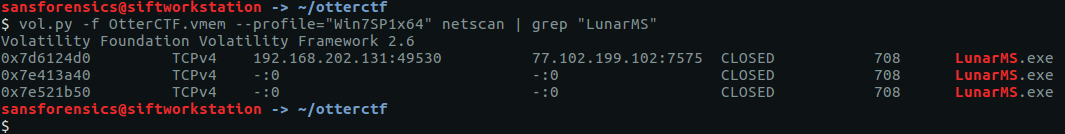
Finding the IP of the server is simply a matter of running the netscan plugin and using grep to filter on the LunarMS process.

vol.py -f OtterCTF.vmem --profile="Win7SP1x64" netscan | grep "LunarMS"

CTF{77.102.199.102}

Question 4 – Name Game

Question 4 - We know that the account was logged in to a channel called Lunar-3. what is the account name?

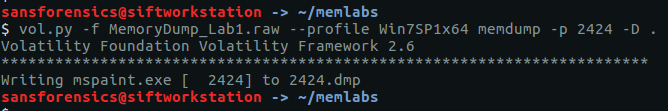
The account name will be somewhere in the process memory; let’s dump that out to make the next step a bit easier. We know the PID of the LunarMS process is 708, so pass that to the memdump plugin, then use strings and grep to filter the output. The -C 10 flag tells grep to return the 10 lines above and below the matching line.

vol.py -f OtterCTF.vmem --profile="Win7SP1x64" memdump -p 708 -D .
strings 708.dmp > 708.dmp.strings
grep -C 10 "Lunar-3" 708.dmp.strings

Given the previous references to otters in this CTF, one line stands out:

CTF{0tt3r8r33z3}

Question 5 – Name Game 2

Question 5 - From a little research we found that the username of the logged on character is always after this signature: 0x64 0x??{6-8} 0x40 0x06 0x??

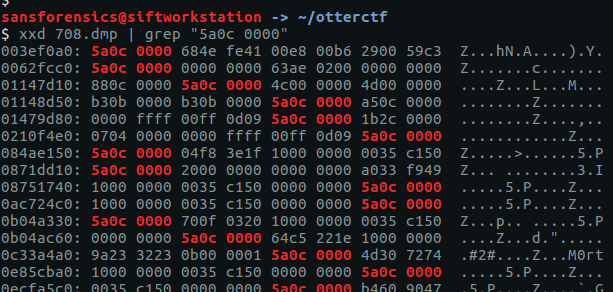
We are given a sequence of bytes and told that the data we want will follow. We already have a dump of the LunarMS process memory from Question 4 so this is all about searching. For simplicity I only used the last eight bytes in the sequence in my search, employing xxd to display the bytes and grep to search for the end of our target pattern.

xxd 708.dmp | grep "5a0c 0000"

There is some human-readable text at 0x0c33a4ac so let’s use xxd again to give us the next 16 bytes of our process memory dump.

That looks like our flag.

CTF{M0rtyL0L}

Question 6 – Silly Rick

Flag 6 - Silly rick always forgets his email's password, so he uses a Stored Password Services online to store his password. He always copy and paste the password so he will not get it wrong. whats rick's email password?

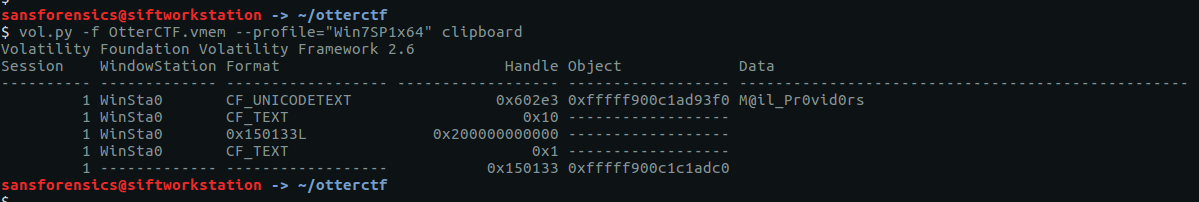
We get a hint that Rick always copies and pastes his password, so the clipboard plugin is likely to give us what we need for this question.

vol.py -f OtterCTF.vmem --profile="Win7SP1x64" clipboard

And there we are – Rick’s  email password.

CTF{M@il_Pr0vid0rs}

Question 7 – Hide and Seek

Flag 7 - The reason that we took rick's PC memory dump is because there was a malware infection. Please find the malware process name (including the extension) BEAWARE! There are only 3 attempts to get the right flag!

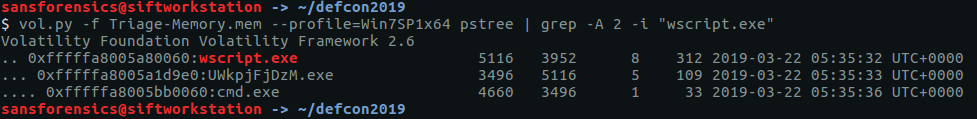
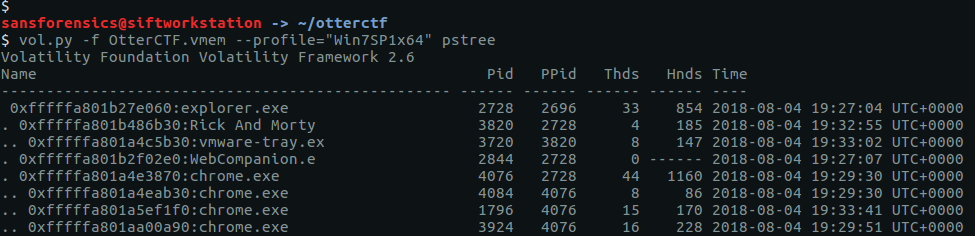
Listing the processes with pstree we can see one called Rick and Morty, with a child process called vmware-tray.ex – that’s unusual.

vol.py -f OtterCTF.vmem --profile="Win7SP1x64" pstree

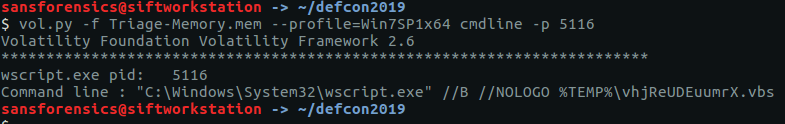
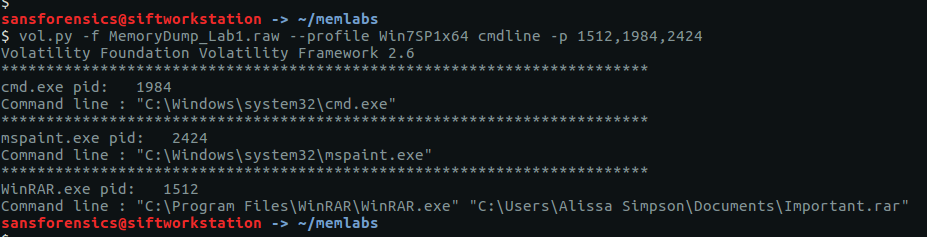
By supplying the PIDs to the cmdline plugin we can see the full command lines associated with both our unusual processes.

vol.py -f OtterCTF.vmem --profile="Win7SP1x64" cmdline -p 3820,3720

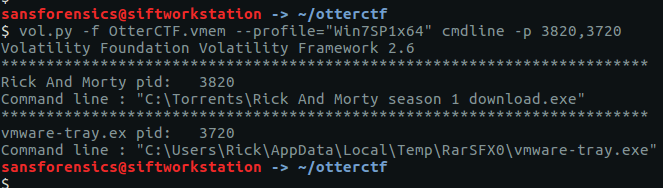
An executable running from the user’s AppData\Local\Temp directory is particularly odd. Submitting the name and extension of the executable gives us our flag.

CTF{vmware-tray.exe}

Question 8 – Path to Glory

Flag 8 - How did the malware got to rick's PC? It must be one of rick old illegal habits...

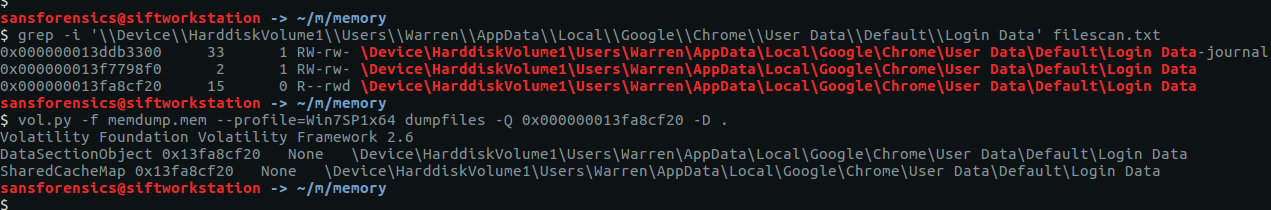
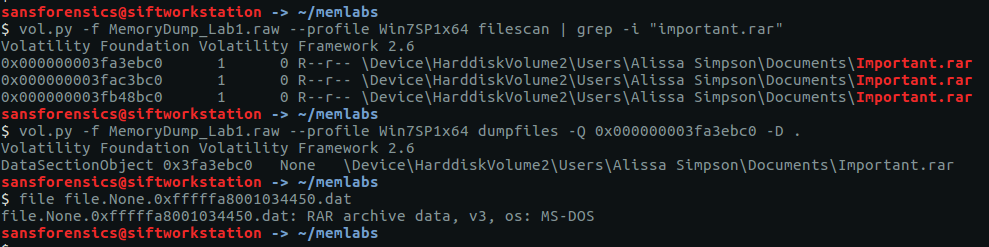
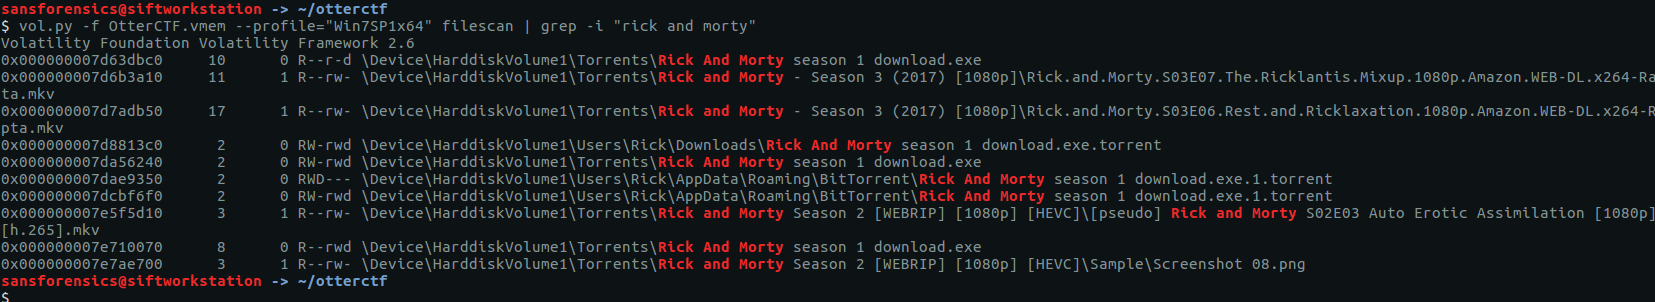
In Question 7 we found a file path suggesting that Bittorrent was involved; let’s go find the associated torrent file. Using the filescan plugin and filtering with grep gives us a few places to look.

vol.py -f OtterCTF.vmem --profile="Win7SP1x64" filescan | grep -i "rick and morty"

We can extract files from the memory image by passing the offset to the dumpfiles plugin.

vol.py -f OtterCTF.vmem --profile="Win7SP1x64" dumpfiles -Q 0x000000007d8813c0 -D .
cat file.None.0xfffffa801af10010.dat

Using the cat utility to display the contents of the file, we see that it is the Zone Identifier rather than the torrent itself. The line ZoneId=3 indicates that the torrent was downloaded from the internet – that might be useful for later. Let’s extract the next candidate for our torrent file.

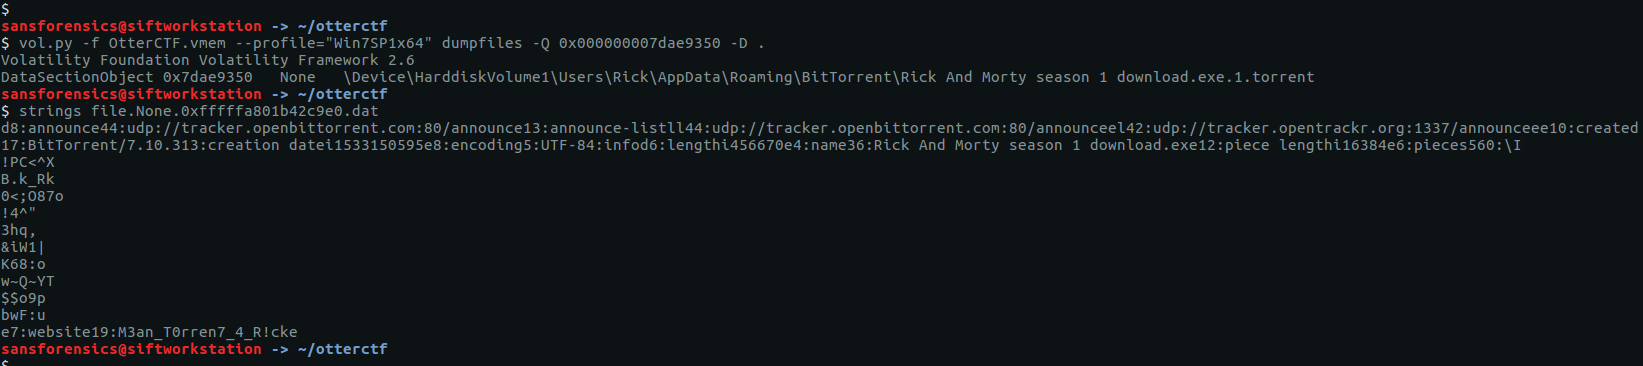
vol.py -f OtterCTF.vmem --profile="Win7SP1x64" dumpfiles -Q 0x000000007dae9350 -D .
strings file.None.0xfffffa801b42c9e0.dat

Running strings this time we can see the details of the torrent, including a comment on the final line that looks like our next flag.

CTF{M3an_T0rren7_4_R!ck}

Question 9 – Path to Glory 2

Flag 9 - Continue the search after the way that malware got in.

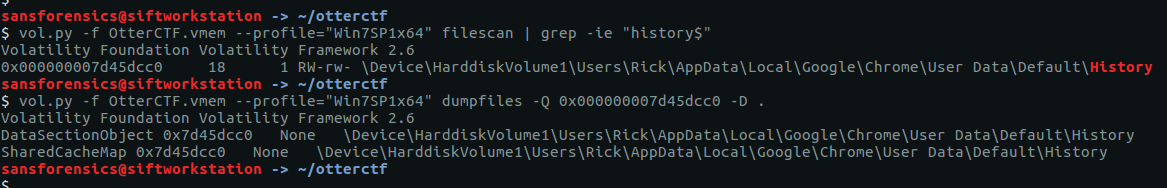
The Zone Identifier file we extracted by mistake in the last question indicates the torrent was downloaded from the internet. The number of chrome.exe processes observed in our pstree output suggests that Google Chrome is the primary browser. As with Question 8 we can use the filescan and dumpfiles plugins to find and extract the Chrome history database.

vol.py -f OtterCTF.vmem --profile="Win7SP1x64" filescan | grep -ie "history$"
vol.py -f OtterCTF.vmem --profile="Win7SP1x64" dumpfiles -Q 0x000000007d45dcc0 -D .

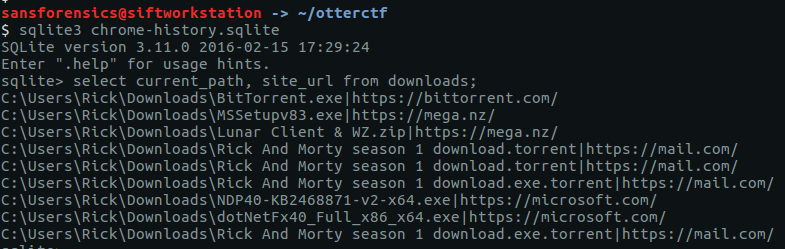
Chrome stores history data in a SQLite database. I renamed the file to chrome-history.sqlite, and used the sqlite3 utility to run the following query:

select current_path, site_url from downloads;

From the output of the database query we can see that the torrent file was downloaded from https://mail.com

Let’s dump the strings from our memory image and look for any artefacts related to mail.com

strings OtterCTF.vmem > OtterCTF.vmem.strings
grep "@mail.com" OtterCTF.vmem.strings

The second line of the grep output resembles the address field of an email header; perhaps some message content was still in memory when the image was made. Using grep with the -A 20 flag to show the 20 lines following Rick’s email address gives us the following:

grep -A 20 "<rickopicko@mail.com>" OtterCTF.vmem.strings

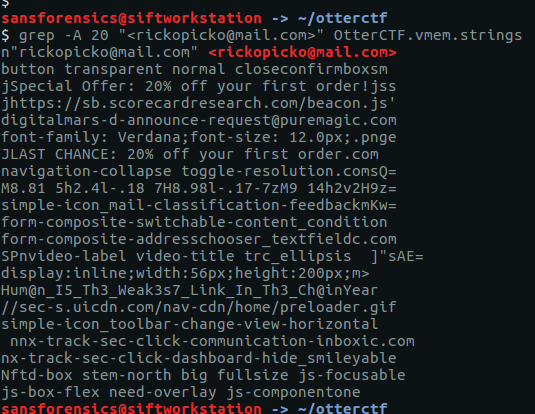
Near the bottom of the output is a curious line of text that looks like our flag, and submitting it as an answer confirms it.

As an alternative method, because we have Rick’s email address and found his password in Question 6, we could try logging into his email account to check. But this is a memory forensics challenge.

CTF{Hum@n_I5_Th3_Weak3s7_Link_In_Th3_Ch@in}

Question 10 – Bit 4 Bit

Flag 10 - We've found out that the malware is a ransomware. Find the attacker's bitcoin address.

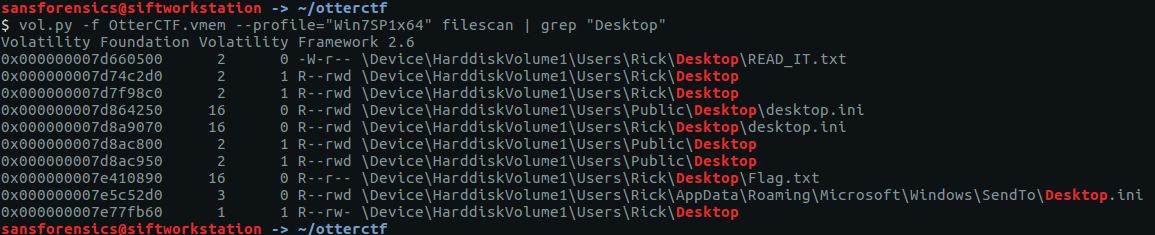
The question tells us that the malware is ransomware of some kind and asks for the associated Bitcoin address. Ransomware tends to drop a ransom note on the Desktop, so let’s look for that first.

vol.py -f OtterCTF.vmem --profile="Win7SP1x64" filescan | grep "Desktop"

READ_IT.txt looks promising, and flag.txt might be useful to remember later on.

vol.py -f OtterCTF.vmem --profile="Win7SP1x64" dumpfiles -Q 0x000000007d660500 -D .
cat file.None.0xfffffa801b2def10.dat

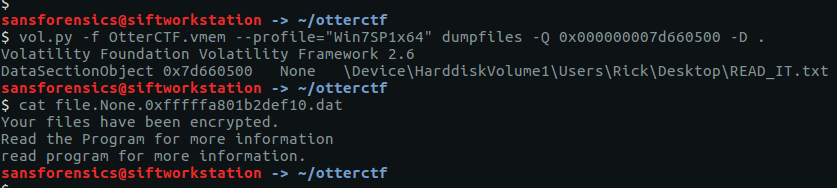
Unfortunately the note only tells us to Read the Program for more information. We identified the ransomware PID in Question 7, so let’s dump the process memory and run strings and grep to search for any mention of “ransom“. Note the slightly different strings command this time; the -e l flag is used to search for Unicode strings.

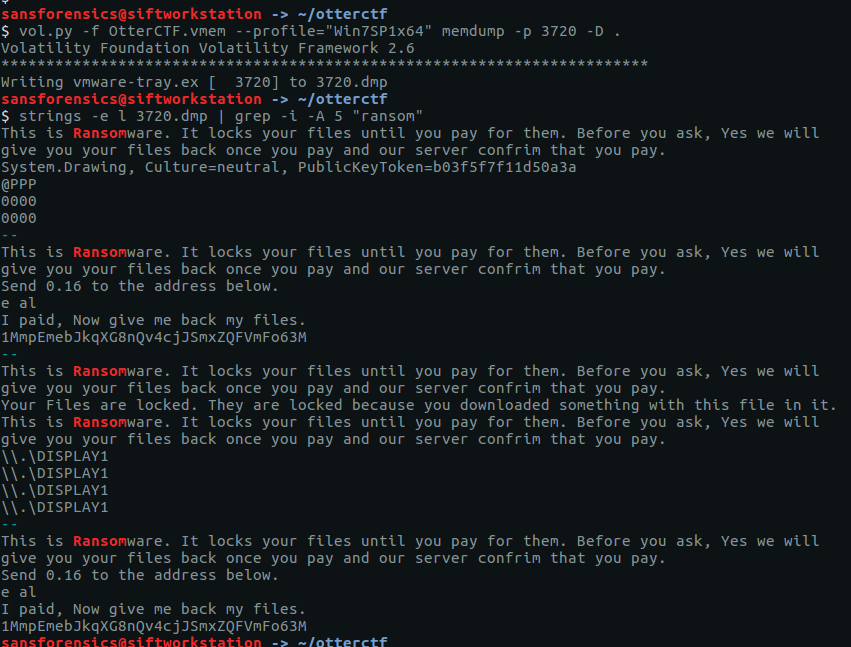
vol.py -f OtterCTF.vmem --profile="Win7SP1x64" memdump -p 3720 -D .
strings -e l 3720.dmp | grep -i -A 5 "ransom"

We have found the payment demand, including the price in Bitcoin and the Bitcoin address.

CTF{1MmpEmebJkqXG8nQv4cjJSmxZQFVmFo63M}

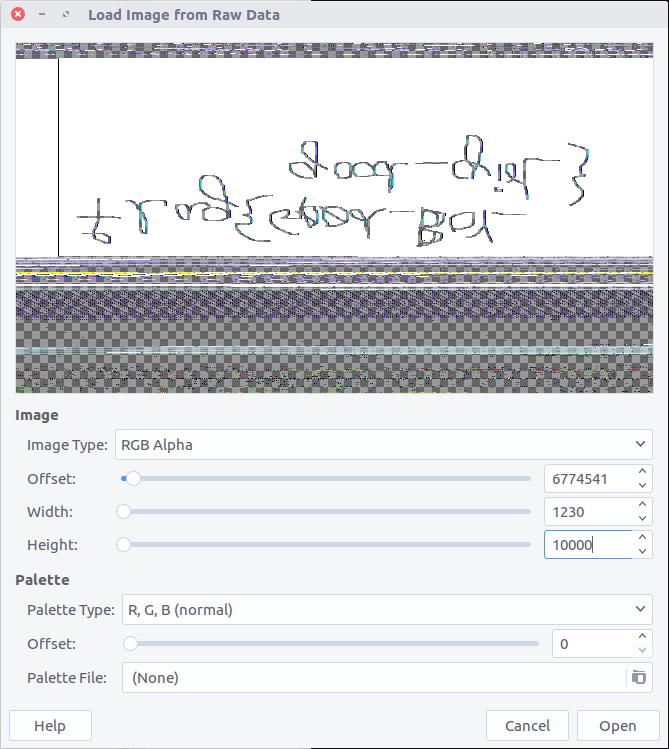
Question 11 – Graphic’s for the Weak

Flag 11 - There's something fishy in the malware's graphics.

The only hint we have is to examine the malware’s graphics. We can dump the process executable using the procdump plugin, then use binwalk and foremost to identify and carve any graphics from the executable. There’s no real need for binwalk here, I just like to have an idea of what to carve for before running foremost.

vol.py -f OtterCTF.vmem --profile="Win7SP1x64" procdump -p 3720 -D .
binwalk executable.3720.exe
foremost -t png executable.3720.exe

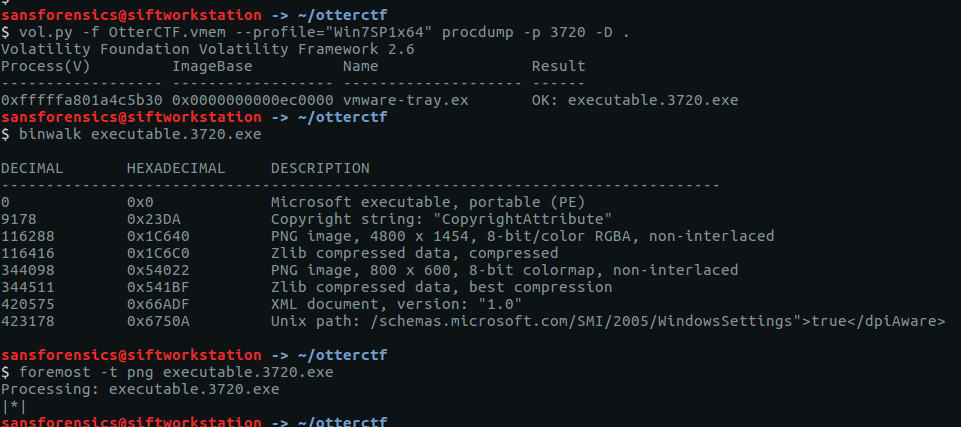
Checking the foremost output, we only have one PNG file but it does contain our flag.

CTF{S0_Just_M0v3_Socy}

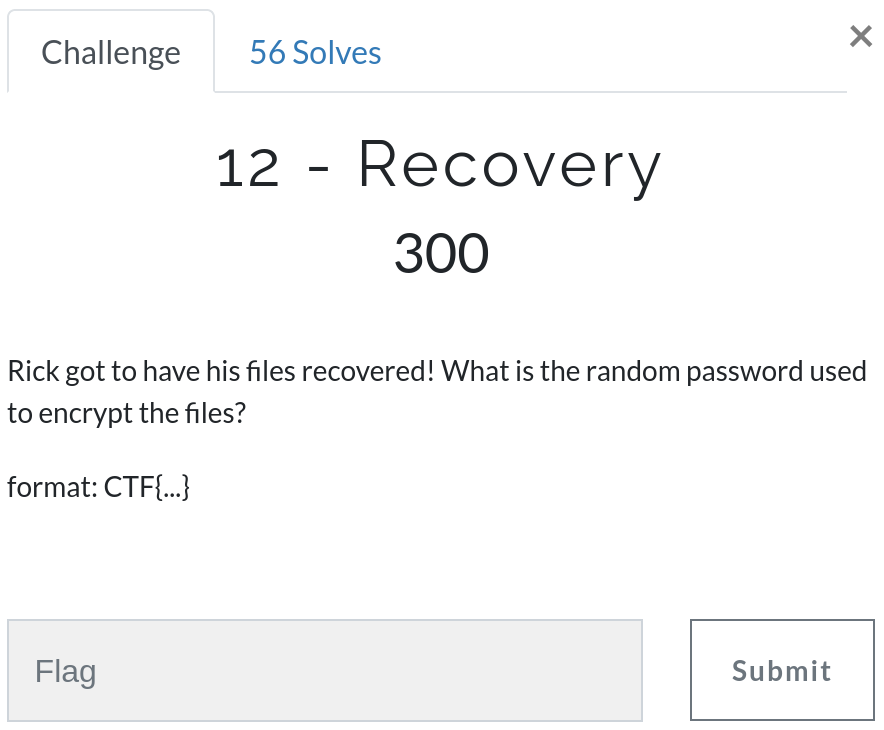
Question 12 – Recovery

Flag 12 - Rick got to have his files recovered! What is the random password used to encrypt the files?

I expected this question to take a lot of trial and error with grep, so for speed I first extracted the human-readable Unicode strings to a file on disk instead of running strings over the whole memory image for every search. The wc -l command shows 374402 lines; let’s try to reduce that to something more manageable by searching for some of the things we have identified so far.

Searching for “password” didn’t turn up anything useful, and “rick” gave too many hits. Searching for the hostname was more promising, returning 212 hits. By using the sort and uniq commands we can eliminate duplicates and end up with a reasonable list to examine manually.

strings -e l 3720.dmp > 3720.dmp.strings
wc -l 3720.dmp.strings
grep "WIN-LO6FAF3DTFE" 3720.dmp.strings | wc -l
grep "WIN-LO6FAF3DTFE" 3720.dmp.strings | sort | uniq

The second last line looks interesting; the hostname and username concatenated together with a seemingly random alpha-numeric string.

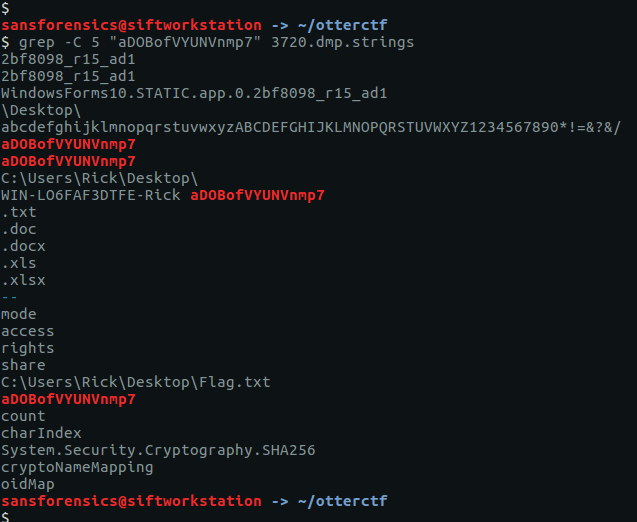
Using grep again we see that this seemingly random string appears multiple times, making it a pretty good candidate for our password.

CTF{aDOBofVYUNVnmp7}

Question 13 – Closure

Flag 13 - Now that you extracted the password from the memory, could you decrypt rick's files?

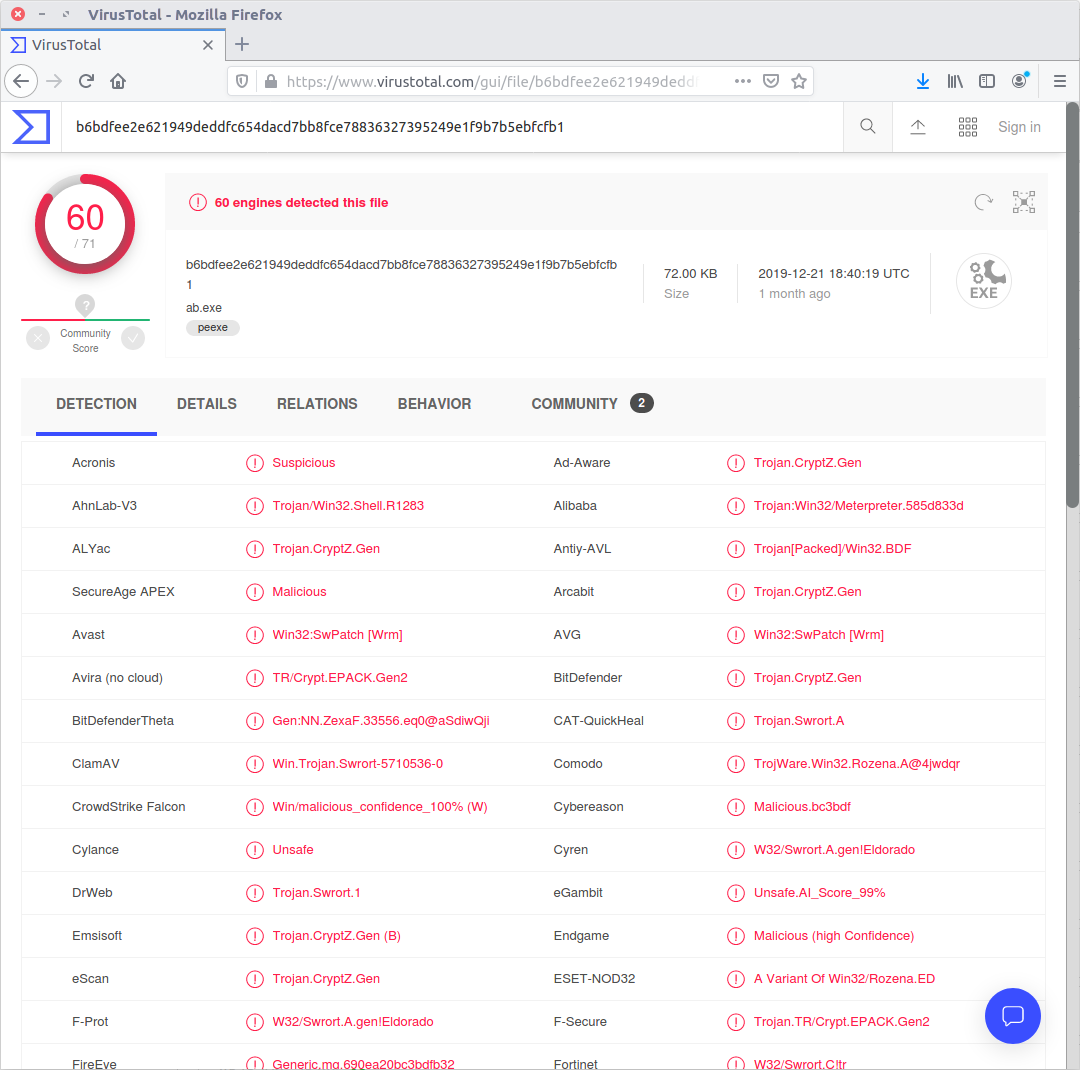
Our final challenge is to use the password from Question 12 to decrypt Rick’s files. First thing we need to find out is the kind of ransomware are we dealing with. We were able to extract the executable from the memory image in Question 11, and it’s possible that someone has already uploaded it to an online sandbox like VirusTotal. Let’s get the SHA1 hash and check.

sha1sum executable.3720.exe

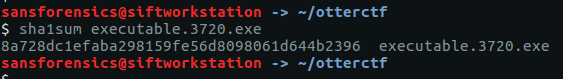
Sure enough, there is a hit on VirusTotal, referencing an alternative executable name (VapeHacksLoader.exe) which is associated with the $ucyLocker ransomware referenced in the graphic we extracted in Question 11. $ucyLocker is a variant of the open-source Hidden Tear ransomware, and with a few Google searches I was able to find a pre-compiled decrypter.

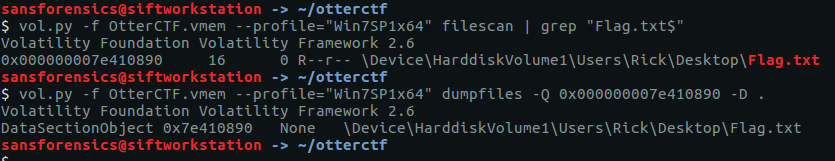
Now we have identified the ransomware and found a decryption utility, let’s extract the file containing the final flag. In Question 10 we saw a file named Flag.txt on Rick’s Desktop.

vol.py -f OtterCTF.vmem --profile="Win7SP1x64" filescan | grep "Flag.txt$"
vol.py -f OtterCTF.vmem --profile="Win7SP1x64" dumpfiles -Q 0x000000007e410890 -D .

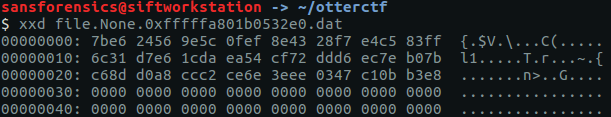
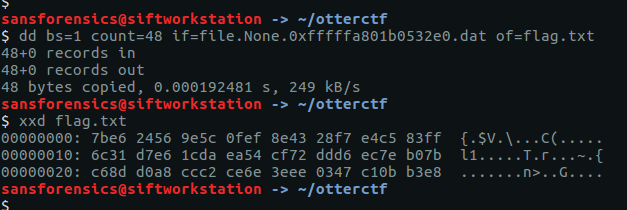
After extracting the file from the memory image we can examine it with xxd, which shows a block of 48 seemingly random bytes, followed by null-byte padding.

xxd file.None.0xfffffa801b0532e0.dat

The padding might cause problems for decrypting, so we extract the bytes we want to a new file called flag.txt using dd.

dd bs=1 count=48 if=file.None.0xfffffa801b0532e0.dat of=flag.txt
xxd flag.txt

As the decryptor would only run on Windows, and because I didn’t entirely trust a pre-compiled decryptor downloaded from the internet, I spun up a Windows 7 VM and copied flag.txt to the Desktop.

After specifying the file extension and supplying the password we extracted in Question 12, the tool ran and output a plaintext file named flag (the file extension having been stripped during decryption).

Opening the newly decrypted flag file gives us our final flag, and completes the memory forensics portion of the CTF.

CTF{Im_Th@_B3S7_RicK_0f_Th3m_4ll}