Category: Memory Analysis
Magnet Weekly CTF – Week 12
The Magnet Forensics Weekly CTF has been running since October and sets one question each week using an image that changes each month. The October questions were based on an Android filesystem dump, and November’s related to a compromised Hadoop cluster built on Ubuntu Linux. The December challenges return to more familiar territory for me – Windows memory analysis!
These questions use the memory image from the Magnet Virtual Summit 2020, which I first examined during the MVS CTF earlier this year. You can find the rest of my Magnet Weekly CTF write-ups here.
We have reached the final challenge of the #MagnetWeeklyCTF and this week the questions were set by Tarah Melton.
Part 1 (30 points)
What is the PID of the application where you might learn “how hackers hack, and how to stop them”?
Format: #### Warning: Only 1 attempt allowed!
Ok, we are trying to link a particular string to a Process ID. I started by extracting the strings from the entire memory image then using a case-insensitive grep search to get a better idea of what we might be looking for.
strings memdump.mem | grep -i "how hackers hack, and how to stop them"
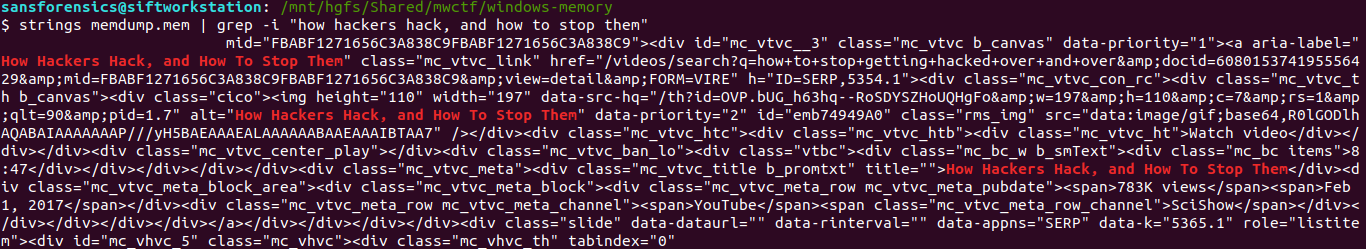
The text surrounding the match looks like HTML so any of the Internet Explorer or Chrome browser processes are likely candidates, but given the number of them I don’t want to dump each process memory and search manually. Instead, now that we know exactly what to look for, we can throw the yarascan plugin at the image and check the Process ID associated with the matching section of memory. Easy.
vol.py -f memdump.mem --profile=Win7SP1x64 yarascan -Y "How Hackers Hack, and How To Stop Them"

Ok, not a great start. Volatility as installed on the pre-built Ubuntu 18.04 SANS SIFT VM throws an exception because of conflicting use of the -C option in the malfind plugin:
Volatility Foundation Volatility Framework 2.6.1
Traceback (most recent call last):
File "/usr/local/bin/vol.py", line 192, in <module>
main()
File "/usr/local/bin/vol.py", line 174, in main
command = cmds[module](config)
File "/usr/local/lib/python2.7/dist-packages/volatility/plugins/malware/malfind.py", line 190, in __init__
help = 'Make the search case insensitive')
File "/usr/local/lib/python2.7/dist-packages/volatility/conf.py", line 363, in add_option
self.optparser.add_option("-{0}".format(short_option), "--{0}".format(option), **args)
File "/usr/lib/python2.7/optparse.py", line 1021, in add_option
self._check_conflict(option)
File "/usr/lib/python2.7/optparse.py", line 996, in _check_conflict
option)
optparse.OptionConflictError: option -C/--case: conflicting option string(s): -C
Fixing the malfind and yarascan Volatility plugins on SIFT 18.04
Luckily I’m not the first person to run into this problem, and an issue submitted to the SIFT github repository contains a workaround:
Make a backup of the malfind.py source file, which in my SIFT VM was located:
/usr/local/lib/python2.7/dist-packages/volatility/plugins/malware/malfind.py
Then open the original file for editing and change the short_option at line 189. The original conflicting option is C (upper-case); I changed this to c (lower-case), as shown below:
config.add_option("CASE", short_option = 'c', default = False, action = 'store_true',
I also had to change the short_option at line 195. The original option Y (upper-case) caused another conflict, so I changed this to U (upper-case), as below:
config.add_option('YARA-RULES', short_option = 'U', default = None,
Now, with those minor changes in place, we can get back to the challenge. Using the modified yarascan plugin, we search for the correctly-capitalised version of the string.
vol.py -f memdump.mem --profile=Win7SP1x64 yarascan -U "How Hackers Hack, and How To Stop Them"

The yarascan plugin finds our string in three different locations, but all within an Internet Explorer process – PID 4480.
Flag (Part 1)
4480
Part 2 (20 points)
What is the product version of the application from Part 1?
XX.XX.XXXX.XXXXX
Part two asks for the version of Internet Explorer that was used. Microsoft suggest a few options to check Internet Explorer release versions; I started by checking the following key in the SOFTWARE registry hive.
grep -E "^Virtual|(SOFTWARE)" out/hivelist.txt
vol.py -f memdump.mem --profile=Win7SP1x64 printkey -o 0xfffff8a0002c9010 -K "Microsoft\Internet Explorer"

We are particularly interested in the value of srcVersion – 11.0.9600.18860 – but this answer was not accepted. Curious. Maybe the Version value – 9.11.9600.18860 – but again, this was not accepted. I noticed that neither of those strings fit the format hint provided in the question, and reading the Microsoft documentation again I saw that 00 version numbers could be truncated to a single 0. Padding the srcVersion value out to 11.00.9600.18860 might be the answer? No.
Time for a different approach. I used the procdump plugin to dump the process executable from memory, then used exiftool to examine the binary metadata. Sure enough, there was a specific Product Version value.
vol.py -f memdump.mem --profile=Win7SP1x64 procdump -p 4480 -D .
exiftool -ProductVersion executable.4480.exe

Reading the question properly helps!
Flag (Part 2)
11.00.9600.18858
That is the end of the Magnet Weekly CTF, at least for 2020. A big “thank you” to everyone involved in setting-up and running the challenge, and to all the other participants who wrote-up and published their solutions each week!
Memlabs Memory Forensics Challenges – Lab 6 Write-up

Memlabs is a set of six CTF-style memory forensics challenges released in January 2020 by @_abhiramkumar and Team bi0s. I have been working on the Magnet Weekly CTF recently so the other write-ups I had in progress have been sitting partially finished for a while now. This write-up covers the final challenge – Lab 6 – The Reckoning. You can find the rest of my Memlabs write-ups here.
MD5: 405985dc8ab7651c65cdbc04cb22961c
SHA1: 344ed78742197c70070e5bdcfeeabf29c0785298
Lab 6. The final challenge in the Memlabs series. This one moves a little bit outside of memory analysis and was a lot of fun. Let’s go!
As usual, the first thing we do is determine which profile Volatility should use for the rest of the analysis.
vol.py -f MemoryDump_Lab6.raw imageinfo
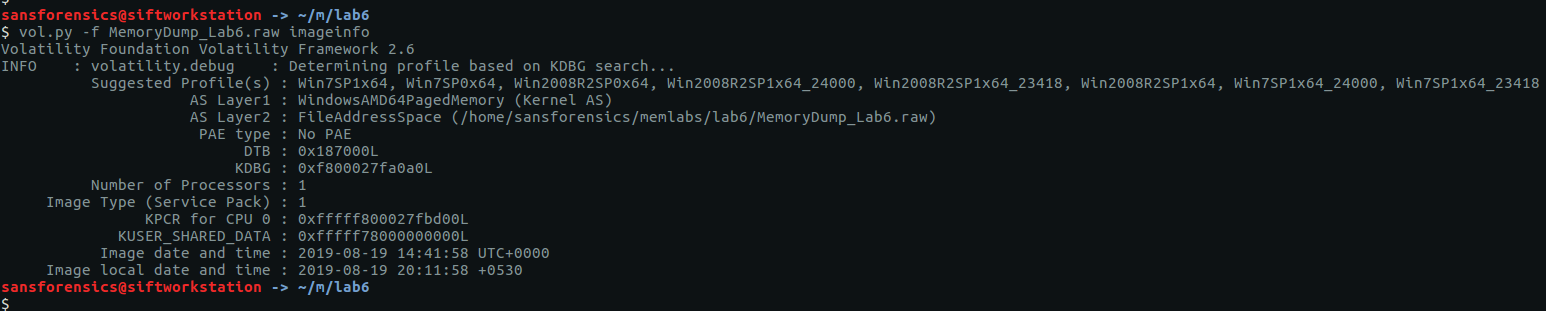
Again, as usual, imageinfo suggests a few suitable profiles; we will use Win7SP1x64 for the rest of the challenge. Checking the running processes with pstree shows that there was quite a lot going on when the memory dump was captured.
vol.py -f MemoryDump_Lab6.raw --profile=Win7SP1x64 pstree

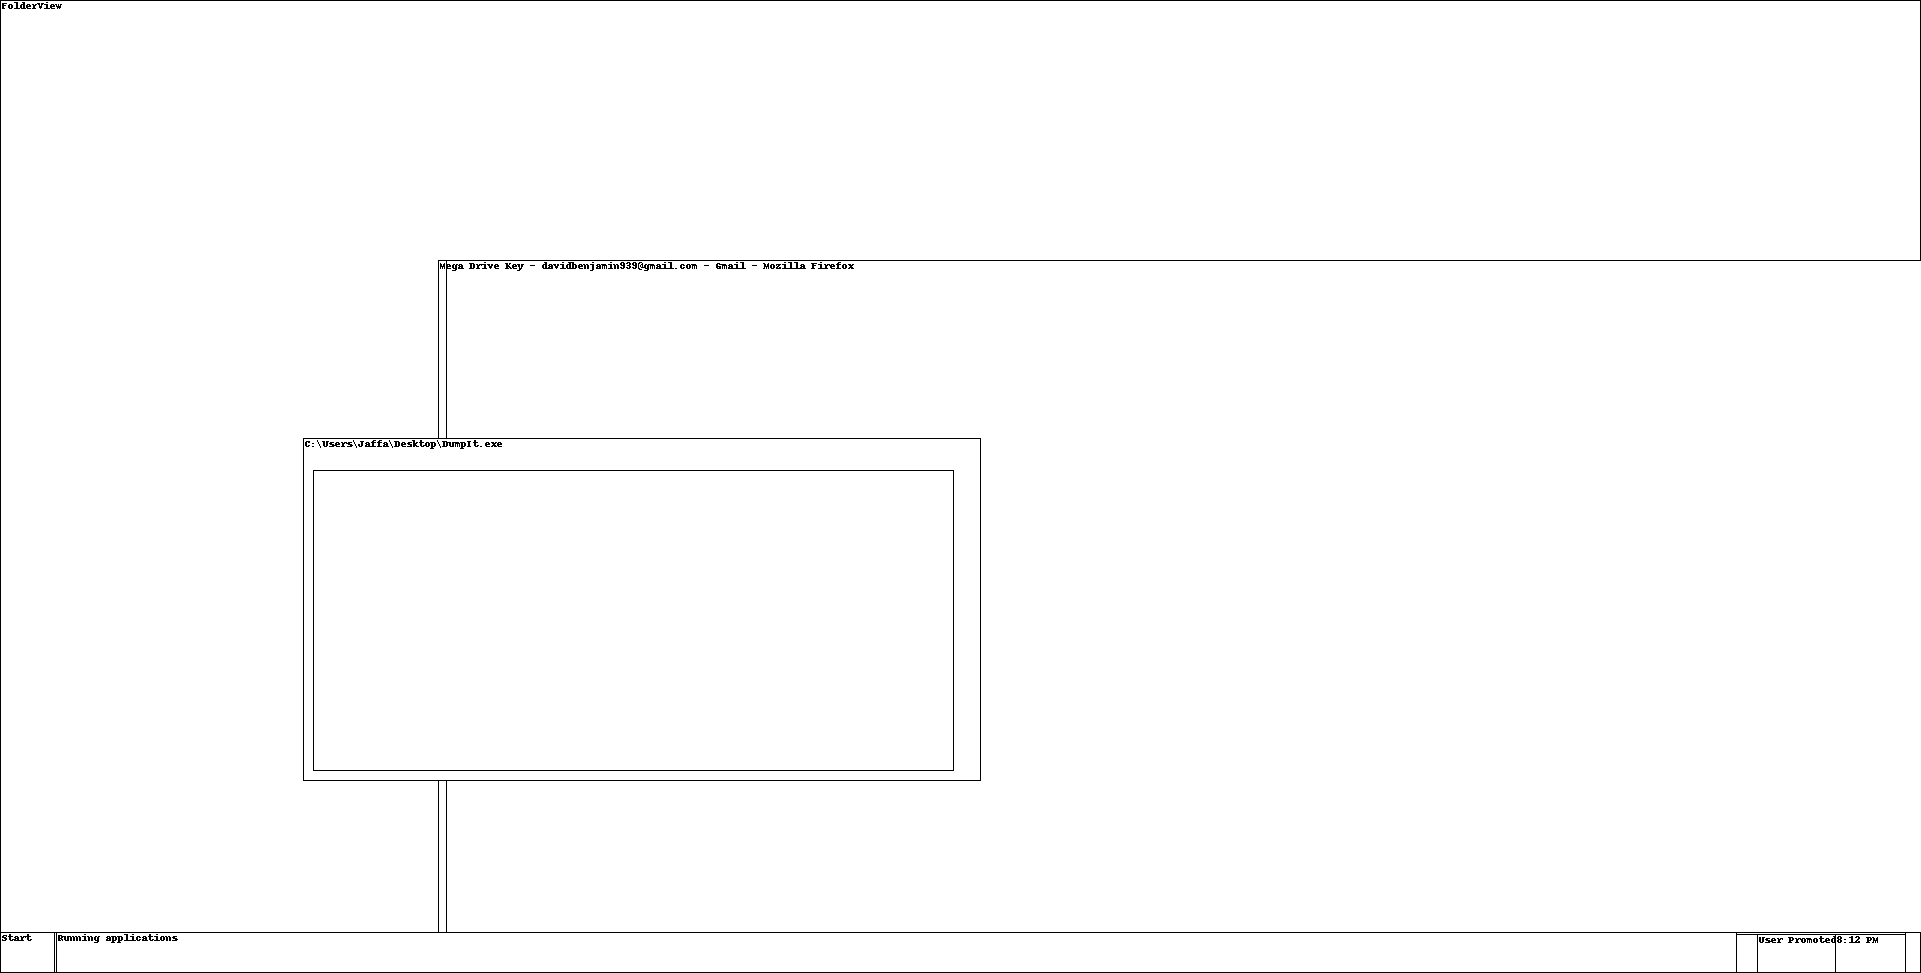
There’s a lot going here. The Chrome and Firefox processes seem like a pretty good starting point, but after picking up a trick in Lab 5, I decided to run the screenshot plugin to get an idea of what was displayed on screen before digging deeper.
vol.py -f MemoryDump_Lab6.raw --profile=Win7SP1x64 screenshot -D screenshot-output/

Examining the output we find one screenshot (session_1.WinSta0.Default.png) showing a Firefox window titled:
Mega Drive Key - davidbenjamin939@gmail.com - Gmail - Mozilla Firefox
That’s interesting, but not immediately helpful. I used the filescan and dumpfiles plugins to extract the Firefox browser history, but found nothing interesting so repeated the process to extract the Chrome history.
vol.py -f MemoryDump_Lab6.raw --profile=Win7SP1x64 filescan > filescan.txt
grep 'Google\\Chrome\\User Data\\Default\\History' filescan.txt
vol.py -f MemoryDump_Lab6.raw --profile=Win7SP1x64 dumpfiles -Q 0x000000005da5a610 -D . -n
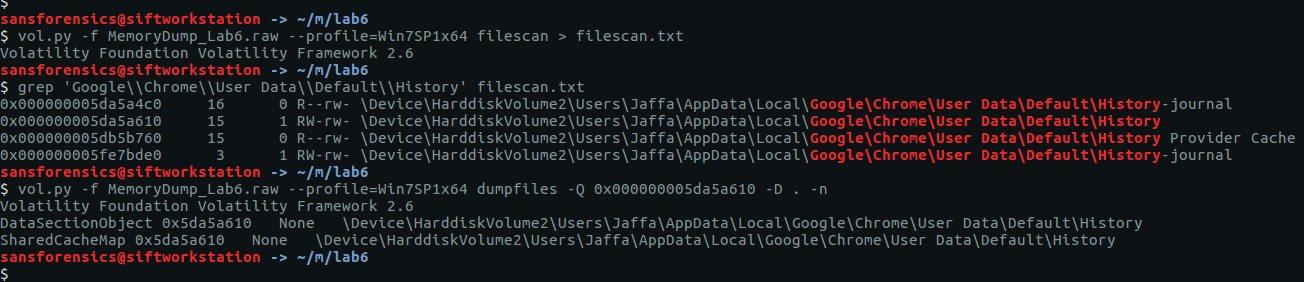
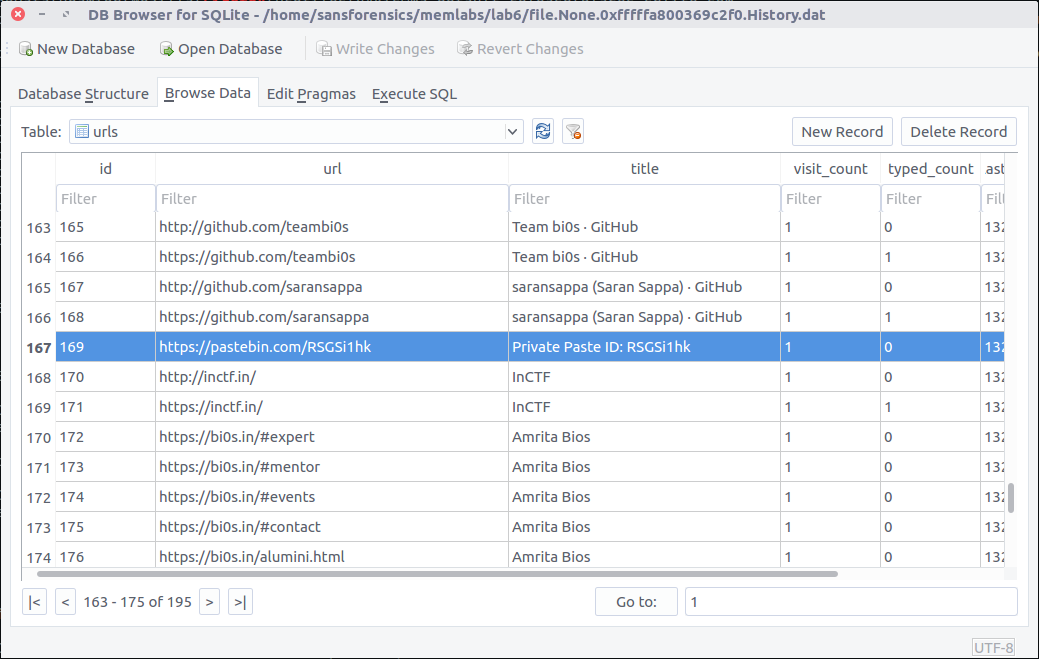
Chrome stores its browsing history as a SQLite database. Loading the extracted file into a GUI SQLite viewer, we find the following Pastebin link in the urls table:
https://pastebin.com/RSGSi1hk
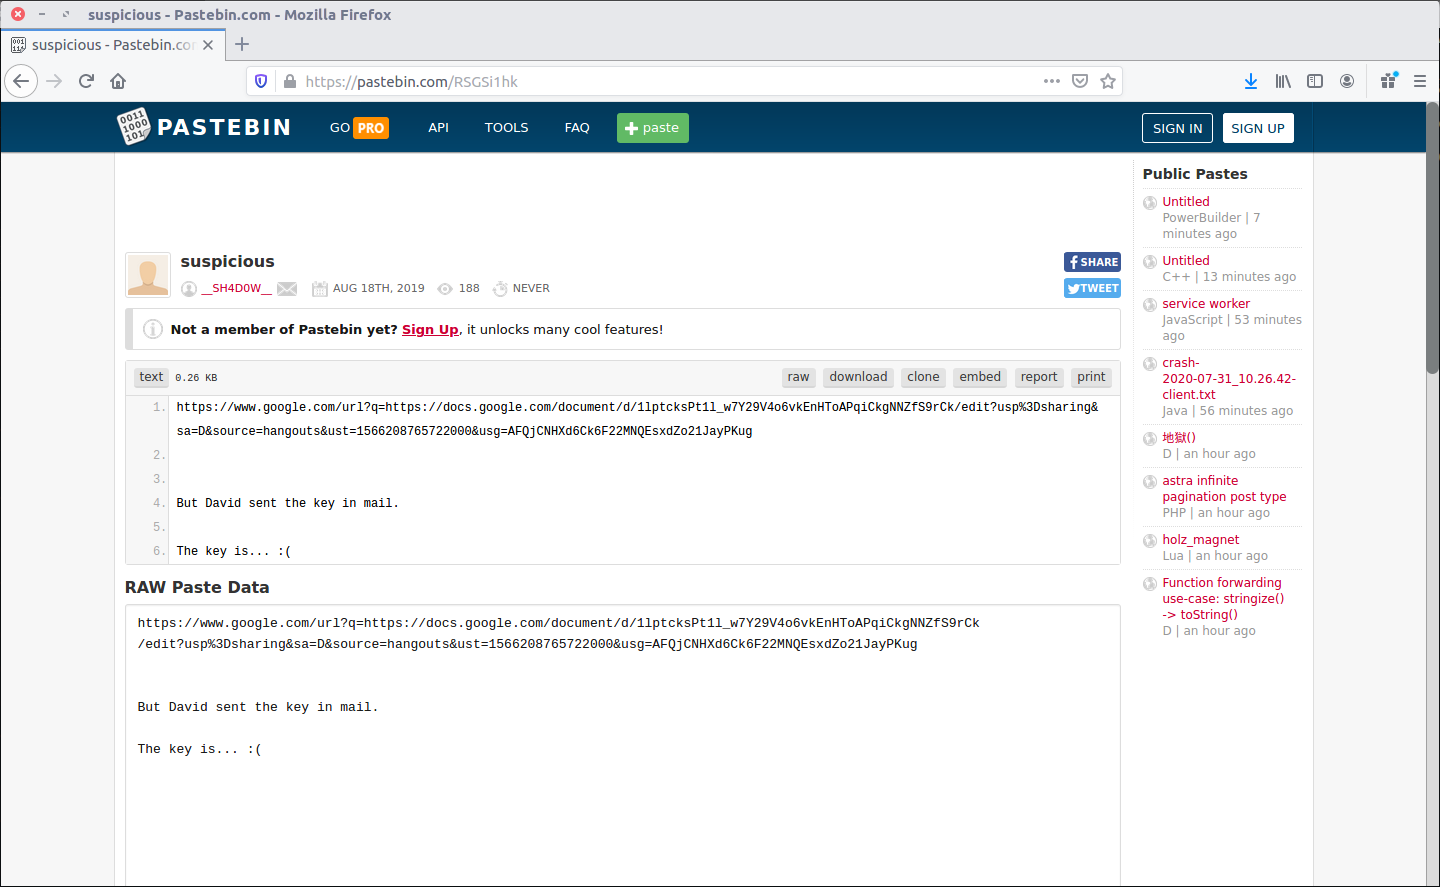
The Pastebin post contains a Google Documents link and a reference to a key. Maybe the same key we saw referenced in the screenshots output earlier?
https://www.google.com/url?q=https://docs.google.com/document/d/1lptcksPt1l_w7Y29V4o6vkEnHToAPqiCkgNNZfS9rCk/edit?usp%3Dsharing&sa=D&source=hangouts&ust=1566208765722000&usg=AFQjCNHXd6Ck6F22MNQEsxdZo21JayPKug
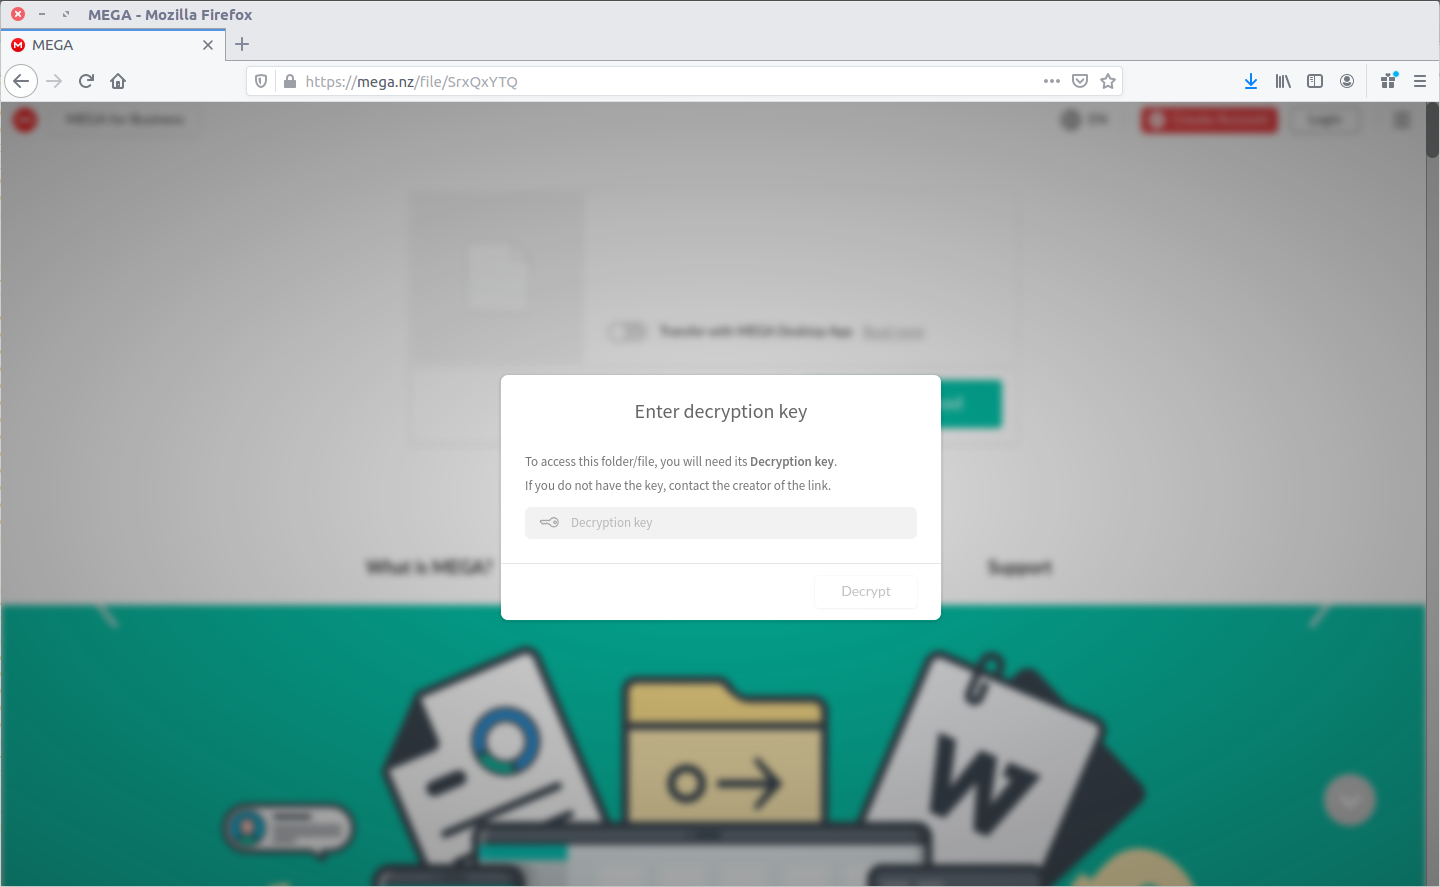
Follow the Google Documents link and we find some pages of stock text, but look a little closer and there is a link to the MEGA file sharing service…
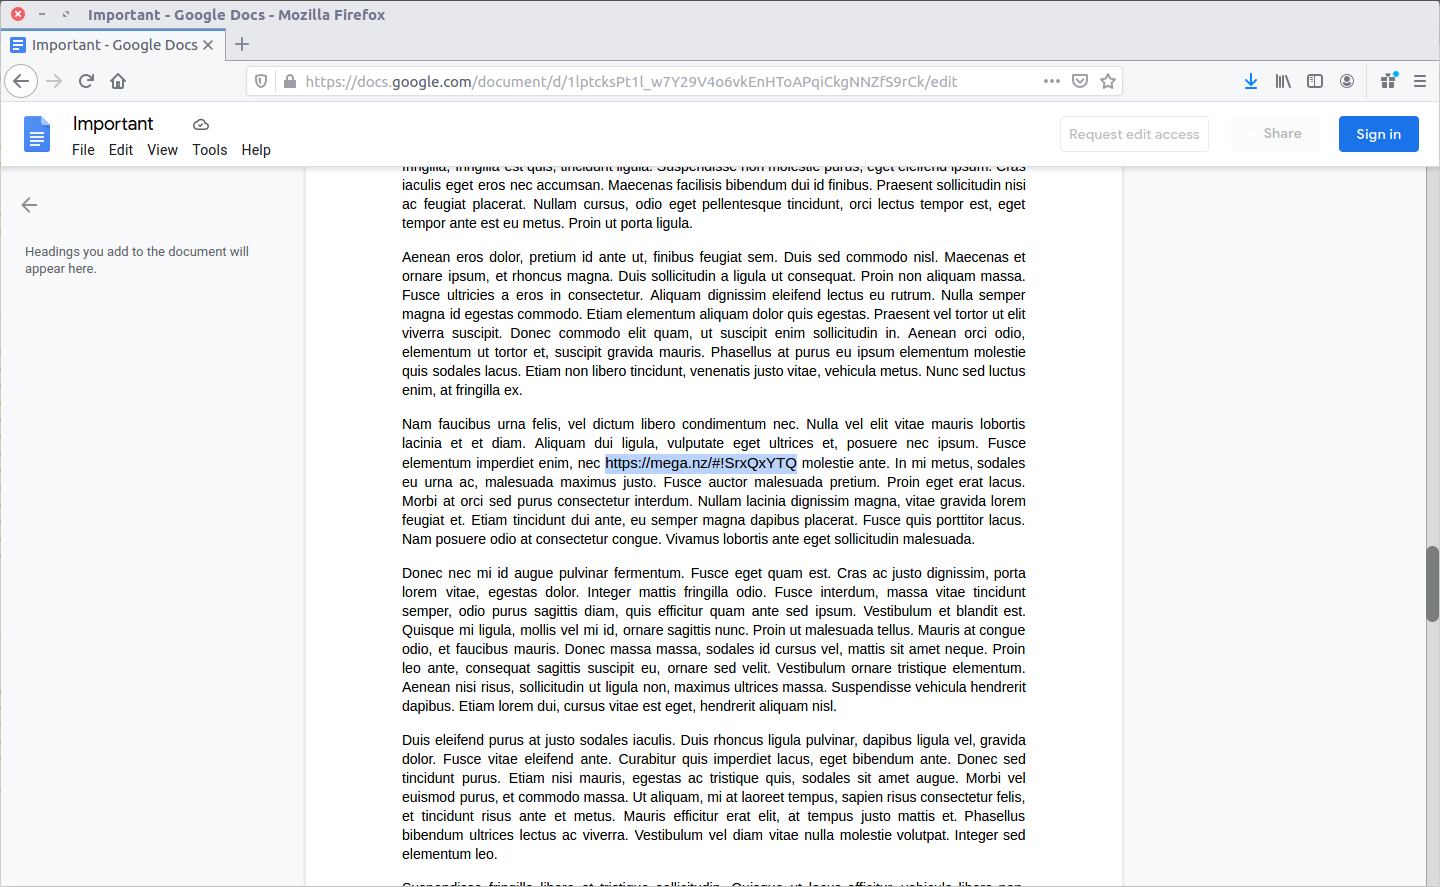
As expected, we need a key to access the MEGA drive:
We can make an educated guess that the key will be in the memory assigned to one of the Firefox processes, but rather than dumping each process individually, I simply grepped the whole memory image for the “Mega Drive Key” string in the Firefox window title. My strings command below uses the -n flag to limit the output to strings of 300 characters or longer; this is simply to make the resulting screenshot look a bit clearer!
strings -n 300 MemoryDump_Lab6.raw | grep 'Mega Drive Key'

Our grep search returns a line that looks somewhat like the source code of a web page, and includes the text we are looking for:
THE KEY IS zyWxCjCYYSEMA-hZe552qWVXiPwa5TecODbjnsscMIU
Now we can access the MEGA drive:

The filename flag_.png is promising but it seems that the file is somehow corrupted:
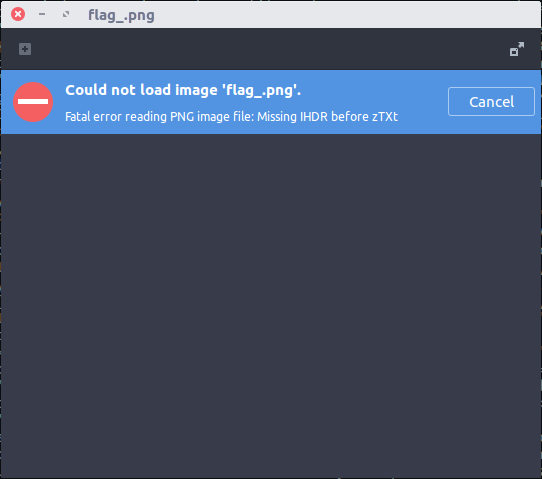
The viewer provides a hint that the IHDR chunk is missing. Let’s open it up in a hex editor and take a closer look. After checking the PNG specification (the PNG Wikipedia article has a nice illustration of how the header should look) I spotted the problem:

Changing the lower-case i (0x69) to an upper-case I (0x49)…

…was all that was needed to open the PNG file correctly and give us the first part of the flag.

inctf{thi5_cH4LL3Ng3_!s_g0nn4_b3_?_
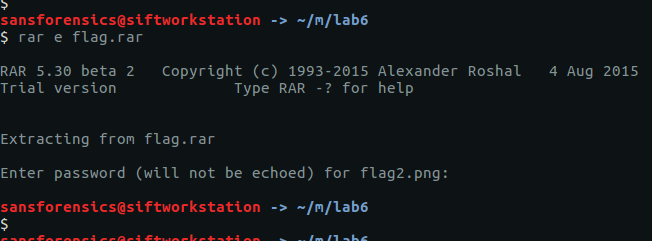
Now to find the second part of the flag. As well as the Firefox and Chrome browser processes, pstree showed us a WinRAR process (PID: 3716). The cmdline plugin can help identify the file that WinRAR was using, then we grep our saved filescan output to find the offset, before finally extracting the archive – flag.rar – using the dumpfiles plugin:
vol.py -f MemoryDump_Lab6.raw --profile=Win7SP1x64 cmdline -p 3716
grep 'Users\\Jaffa\\Desktop\\pr0t3ct3d\\flag.rar' filescan.txt
vol.py -f MemoryDump_Lab6.raw --profile=Win7SP1x64 dumpfiles -Q 0x000000005fcfc4b0 -D . -n

We’re not done yet though! We still need to find another password to open the RAR archive.
Thinking back to Lab 2 I used the envars plugin to list all of the environment variables in use, and one immediately stood out. Using grep for highlighting, we can see that it was not so subtly hidden!
vol.py -f MemoryDump_Lab6.raw --profile=Win7SP1x64 envars | grep 'RAR password'
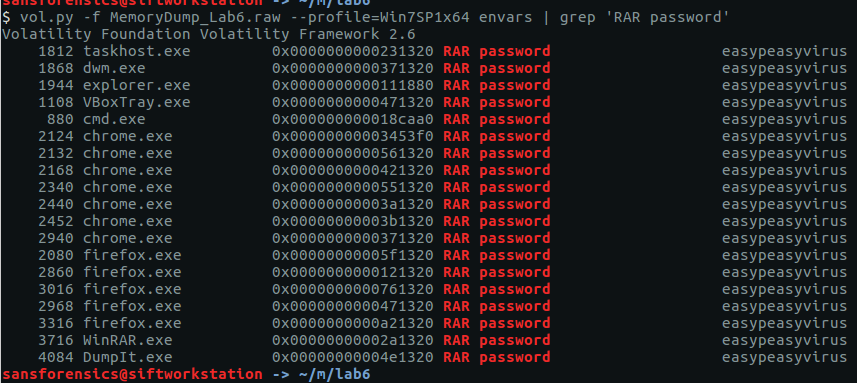
There we go. An environment variable named “RAR password” with a value “easypeasyvirus“. Now we can open the archive…

And read the second part of our flag:

aN_Am4zINg_!_i_gU3Ss???}
Put the two parts together and we have completed the final Memlabs challenge!
inctf{thi5_cH4LL3Ng3_!s_g0nn4_b3_?_aN_Am4zINg_!_i_gU3Ss???}
Magnet Weekly CTF – Week 11
The Magnet Forensics Weekly CTF has been running since October and sets one question each week using an image that changes each month. The October questions were based on an Android filesystem dump, and November’s related to a compromised Hadoop cluster built on Ubuntu Linux. The December challenges return to more familiar territory for me – Windows memory analysis!
These questions use the memory image from the Magnet Virtual Summit 2020, which I first examined during the MVS CTF earlier this year. You can find the rest of my Magnet Weekly CTF write-ups here.
The Week 11 questions were set by Lynita Hinsch and, unusually for a memory analysis challenge, I didn’t use Volatility at all this week. Instead, inspired by Kevin Pagano’s solution for Week 10, I used Bulk Extractor and Wireshark to quickly examine network activity extracted from the memory image.
Part 1 (20 points)
What is the IPv4 address that myaccount.google.com resolves to?
One of my favourite things about the Magnet Weekly CTF is reading write-ups from the other participants. A lot of the time we solve the challenges in the same way, but every so often I come across some technique or tool that I had no idea existed! One such technique was using Bulk Extractor to carve network activity from a memory image into a PCAP file that could then be analysed in Wireshark. I’ve used Bulk Extractor before, but had no idea it could do that!
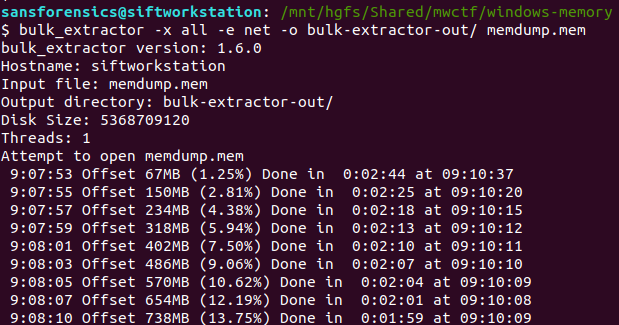
The following command disables all of the Bulk Extractor modules (-x all), then enables the network module (-e net) and writes output to the specified directory.
bulk_extractor -x all -e net -o bulk-extractor-out/ memdump.mem
A few minutes later we have a PCAP file! From here on this is essentially a network analysis task. Opening the PCAP in Wireshark we can quickly filter the DNS responses for myaccount.google.com:
dns.resp.name == "myaccount.google.com"

In this case the initial response was a CNAME record, which led to the A record, and ultimately to the IPv4 address.
Flag (Part 1)
172.217.10.238
Part 2 (5 points)
What is the canonical name (cname) associated with Part 1?
Wireshark makes this easy. The CNAME record was included in the same DNS response packet, giving us the second flag.

Flag (Part 2)
www3.l.google.com
Magnet Weekly CTF – Week 10
The Magnet Forensics Weekly CTF has been running since October and sets one question each week using an image that changes each month. The October questions were based on an Android filesystem dump, and November’s related to a compromised Hadoop cluster built on Ubuntu Linux. The December challenges return to more familiar territory for me – Windows memory analysis!
These questions use the memory image from the Magnet Virtual Summit 2020, which I first examined during the MVS CTF earlier this year. You can find the rest of my Magnet Weekly CTF write-ups here.
Week 10 is another multi-part question and was set by Jamey Tubbs. This write-up follows on from Week 9 where I made a point of saving my Volatility output for later reference, so you might want to read my Week 9 write-up to see how I approached the initial stages of the analysis.
Part 1 (15 Points)
At the time of the RAM collection (20-Apr-20 23:23:26- Imageinfo) there was an established connection to a Google Server.
What was the Remote IP address and port number? format: “xxx.xxx.xx.xxx:xxx”
We want to examine the network connections that were active at the time the memory dump was captured; the netscan plugin will dump these out for us.
vol.py -f memdump.mem --profile=Win7SP1x64 netscan | tee out/netscan.txt
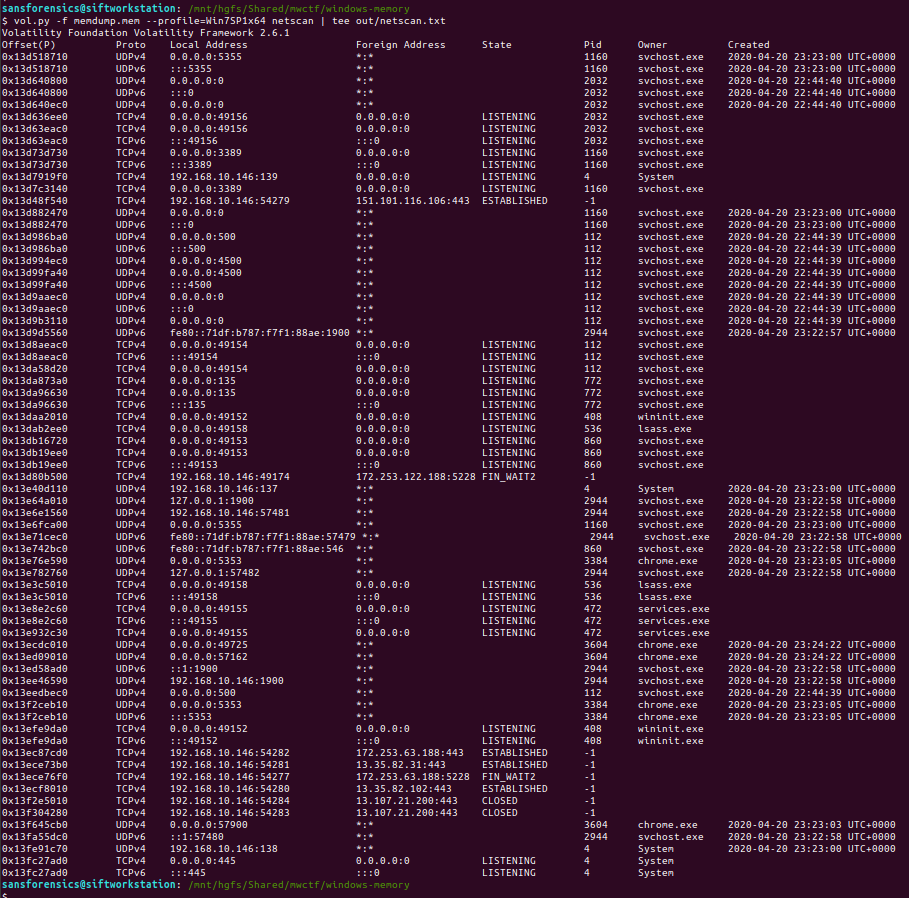
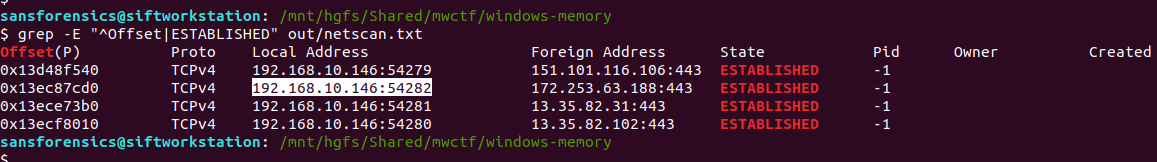
We are looking specifically for established connections, which can be filtered from the saved output using grep:
grep -E "^Offset|ESTABLISHED" out/netscan.txt

Unfortunately we don’t have any timestamps associated with these connections yet, but using whois it is a simple task to determine which of the four IP addresses belongs to Google:
whois 151.101.116.106 | grep -E "^NetName|^OrgName"
whois 172.253.63.188 | grep -E "^NetName|^OrgName"
whois 13.35.82.31 | grep -E "^NetName|^OrgName"
whois 13.35.82.102 | grep -E "^NetName|^OrgName"

The question asks us to supply the IP address and port number, so back to our list of established connections and submit both as the answer to Part 1.

Flag (Part 1)
172.253.63.188:443
Part 2 (15 points)
What was the Local IP address and port number?
We already know this from our work to answer Part 1.
Flag (Part 2)
192.168.10.146:54282
Part 3 (10 points)
What was the URL?
This part wasn’t so obvious initially. I tried running strings and Volatility’s yarascan plugin looking for any references to the IP address, but did not find anything useful. After looking at the running processes again (saved pstree output) I extracted the Google Chrome browser history…
grep "Chrome\\\User Data\\\Default\\\History" out/filescan.txt
vol.py -f memdump.mem --profile=Win7SP1x64 dumpfiles -Q 0x000000013fdc56b0 -D. -n
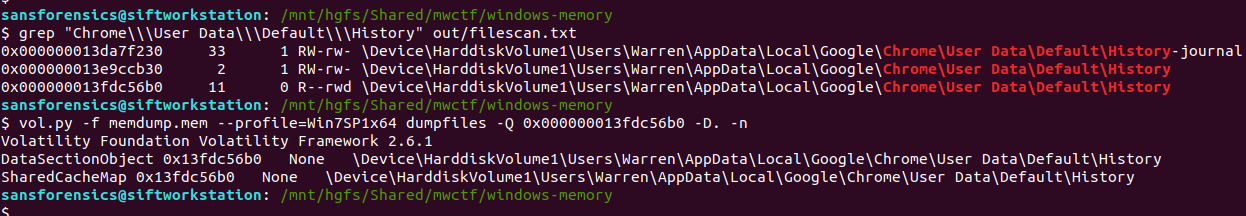
…and examined the urls table using sqlite3:
sqlite3 file.None.0xfffffa80311c7eb0.History.dat
sqlite> .headers on
sqlite> SELECT datetime(last_visit_time/1000000-11644473600, "unixepoch") as last_visited, url, title, visit_count FROM urls ORDER BY last_visited DESC LIMIT 1;
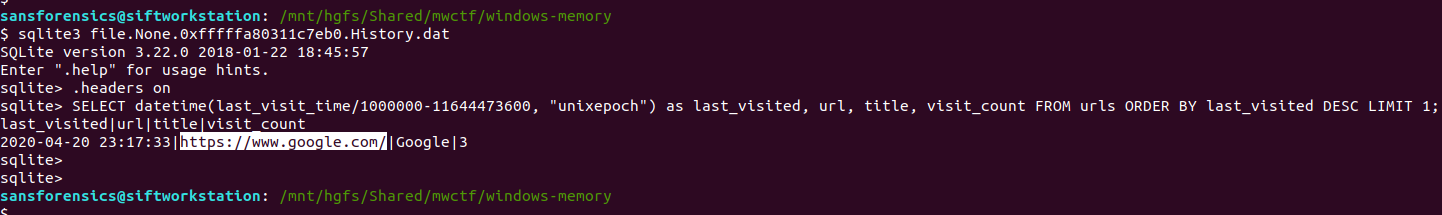
The timestamp of the most recently visited URL doesn’t match the time of the memory capture exactly, but it is close enough to be worth submitting.
Flag (Part 3)
https://www.google.com
Part 4 (5 points)
What user was responsible for this activity based on the profile?
Again, we already know the answer to this one based on Part 3, where we extracted the Google Chrome history database from Warren’s user profile.

Flag (Part 4)
Warren
Part 5 (20 points)
How long was this user looking at this browser with this version of Chrome? *format: X:XX:XX.XXXXX * Hint: down to the last second
Now this is the part that caused the most trouble! Part 5 was initially worth 10 points, but later in the week it was assigned an extra 10 points, and a hint was added which could be unlocked by spending some points. In the end, this question was actually pretty simple. I spent more time trying to work out what the question was asking than actually solving it!
We are looking for some record of application execution, and after consulting the SANS Windows Forensic Analysis poster I realised that the UserAssist registry keys would likely hold the answer. The UserAssist keys are held in the user’s ntuser.dat hive, and for reasons only apparent to Microsoft, are ROT13 encoded. As I was mentally preparing myself to extract and decode all these GUIDs I looked again at the list of plugins shipped with Volatility on my SIFT VM, and found Jamie Levy’s amazing userassist plugin!
The userassist plugin produces a lot of output! As usual I redirected this to a file, and used grep to find any data relating to Google Chrome.
vol.py -f memdump.mem --profile=Win7SP1x64 userassist > out/userassist.txt
grep -i -A 11 -E "^REG_BINARY *chrome*" out/userassist.txt

The value we are interested in is Time Focused, which tracks the length of time that a GUI application was active on the screen.
At this point I was pretty sure I had the challenge solved for the week, but my answer of 3:36:47.301000 was rejected. What else could it be? I looked at the question again and counted the length of the formatting hint – my answer was one digit too long. I dropped the trailing 0, and my answer was accepted.
Flag (Part 5)
3:36:47.30100
Magnet Weekly CTF – Week 9
The Magnet Forensics Weekly CTF has been running since October and sets one question each week using an image that changes each month. The October questions were based on an Android filesystem dump, and November’s related to a compromised Hadoop cluster built on Ubuntu Linux. The December challenges return to more familiar territory for me – Windows memory analysis!
These questions use the memory image from the Magnet Virtual Summit 2020, which I first examined during the MVS CTF earlier this year. You can find the rest of my Magnet Weekly CTF write-ups here.
The Week 9 question (all seven parts of it!) was written by Aaron Sparling, and begins with recovering the user’s notes on changing one of their passwords. Let’s go!
Part 1 (25 points)
The user had a conversation with themselves about changing their password. What was the password they were contemplating changing too. Provide the answer as a text string.
I like to use Volatility for memory analysis; version 2.6.1 was installed on my SIFT VM. As usual we begin by determining which profile is best to use with the image using the imageinfo plugin. I’m also piping the output to tee so that everything is written to a text file for reference later on.
vol.py -f memdump.mem imageinfo | tee /mnt/hgfs/Shared/mwctf/windows-memory/out/imageinfo.txt

The imageinfo plugin suggested the Win7SP1x64 profile, which seems sensible enough. The next plugin I like to run is pstree; this will show most of the processes that were running when the memory was captured, giving us an idea of what was happening on the host.
vol.py -f memdump.mem pstree | tee /mnt/hgfs/Shared/mwctf/windows-memory/out/pstree.txt
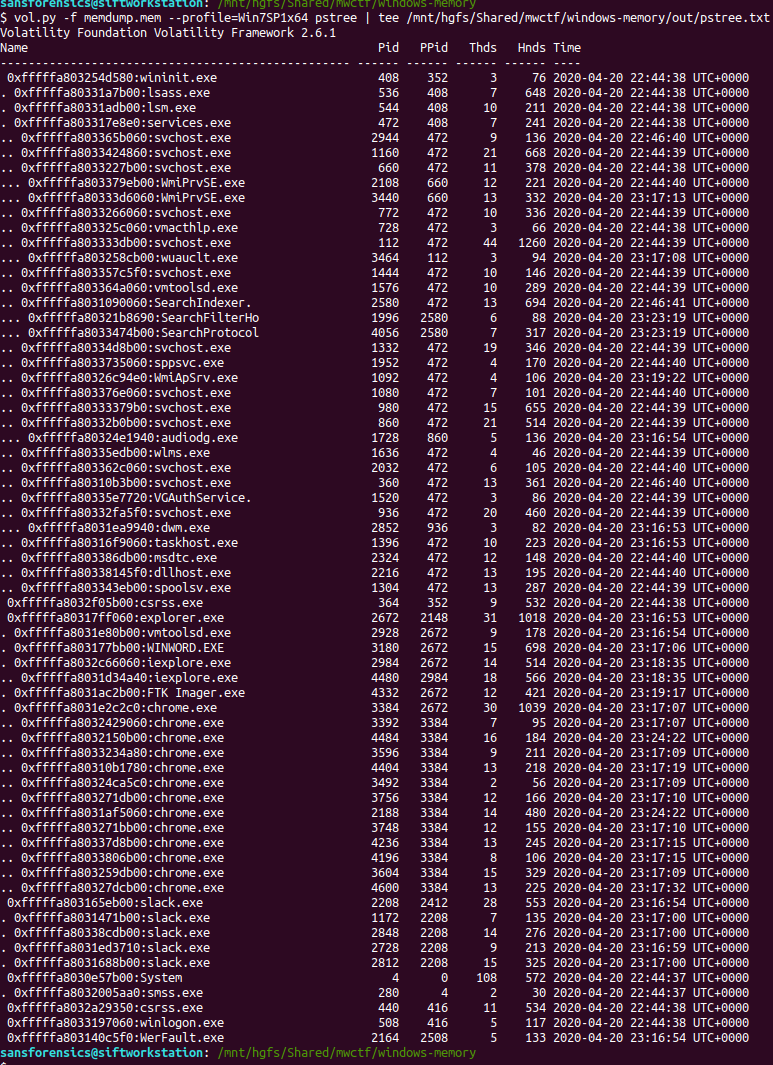
The question references the user having a conversation so I started off by dumping the memory from the Slack processes and examining the output of strings, but I didn’t find anything useful. Next, I looked at the WINWORD.EXE (PID: 3180) process. Perhaps the user wrote their conversation into a file? I started with the cmdline plugin in the hope that Word was opened with a file path in the command line.
vol.py -f memdump.mem --profile=Win7SP1x64 cmdline -p 3180 | tee /mnt/hgfs/Shared/mwctf/windows-memory/out/cmdline-3180.txt

Unfortunately not, but there are other ways of determining which files a process was using. The handles plugin, with a filters on the process and handle types will output a list of all of the files in use by the Word process.
vol.py -f memdump.mem --profile=Win7SP1x64 handles -p 3180 -t File | tee /mnt/hgfs/Shared/mwctf/windows-memory/out/handles-3180-file.txt
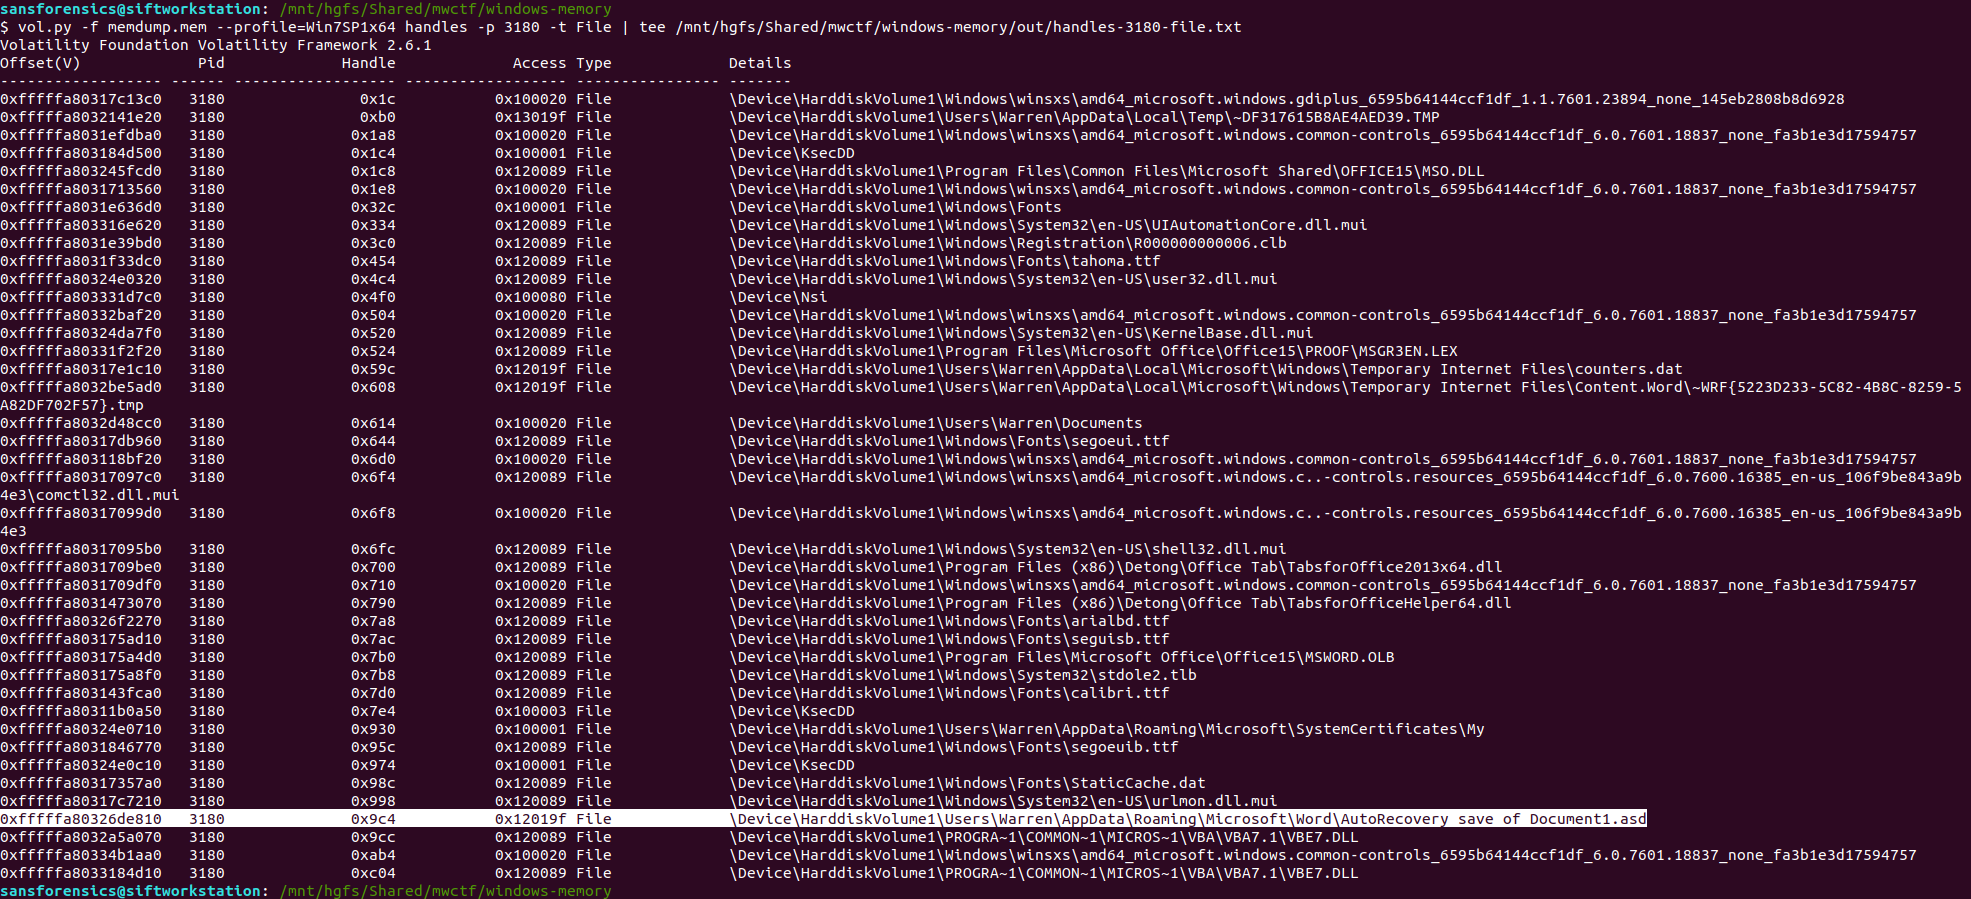
One file stood out – AutoRecovery save of Document1.asd – from user Warren’s profile. This file might not exist on disk anymore, but we can probably extract it from the memory dump. The first step is to run the filescan command, saving the output to a file for use later.
vol.py -f memdump.mem --profile=Win7SP1x64 filescan | tee /mnt/hgfs/Shared/mwctf/windows-memory/out/filescan.txt
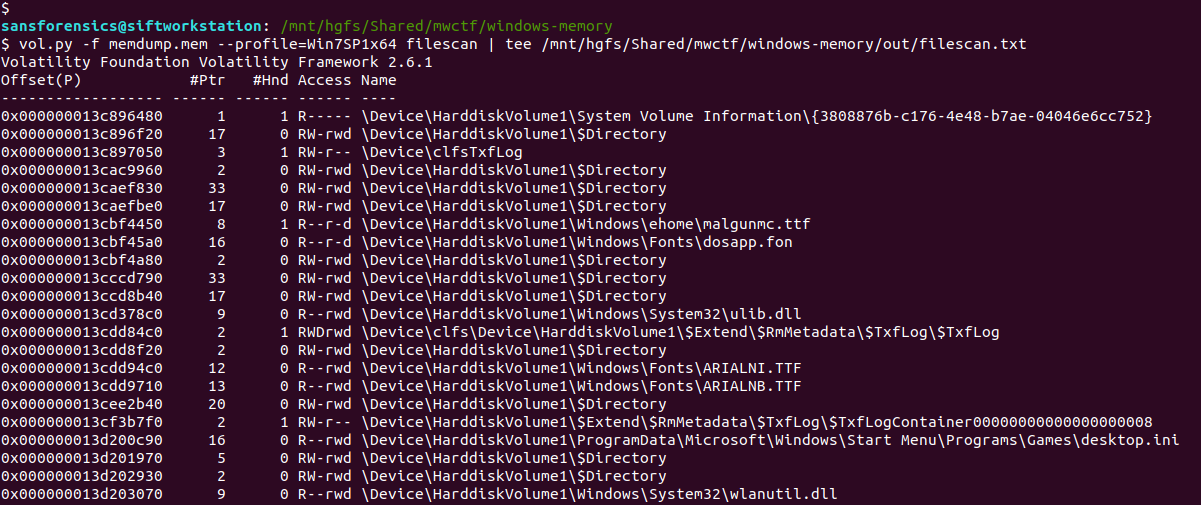
Next I used grep to locate the physical offset of the file, then ran the dumpfiles Volatility plugin to extract the file from the memory image.
grep "AutoRecovery save of Document1.asd" out/filescan.txt
vol.py -f memdump.mem --profile=Win7SP1x64 dumpfiles -Q 0x000000013e6de810 -D. -n

Opening the extracted file with LibreOffice, we can see the user’s conversation with themselves, and their proposed new password.

Flag (Part 1)
wow_this_is_an_uncrackable_password
Part 2 (15 points)
What is the md5 hash of the file which you recovered the password from?
This part is easy enough. We have already extracted the auto-recovery document so all we need to do is calculate the MD5 hash.
md5sum file.None.0xfffffa803316f710.AutoRecovery\ save\ of\ Document1.asd.dat

Flag (Part 2)
af1c3038dca8c7387e47226b88ea6e23
Part 3 (15 points)
What is the birth object ID for the file which contained the password?
On a NTFS filesystem, every entry in the Master File Table (MFT) contains a number of GUIDs which make up the $OBJECT_ID attribute. While the Object ID might change over the life of the file, the Birth Object ID is a record of the first Object ID assigned and should never change.
We can extract the MFT as it existed at the time of the memory capture using Volatility’s mftparser plugin. You will almost always want to redirect the output of mftparser to a file and, as per the warning, the parser can take a while (although more likely minutes than hours!) The other warnings during the extraction don’t appear to have had any ill effect on the rest of the analysis.
vol.py -f memdump.mem --profile=Win7SP1x64 mftparser --output-file=out/mftparser.txt

Once mftparser has completed we can search for the MFT entry related to the AutoRecovery file using grep; the -B 20 and -A 11 options print the 20 lines before the matching line, and 11 lines after, just to keep the output tidy.
grep -B 20 -A 11 "AutoRecovery save of Document1.asd" out/mftparser.txt
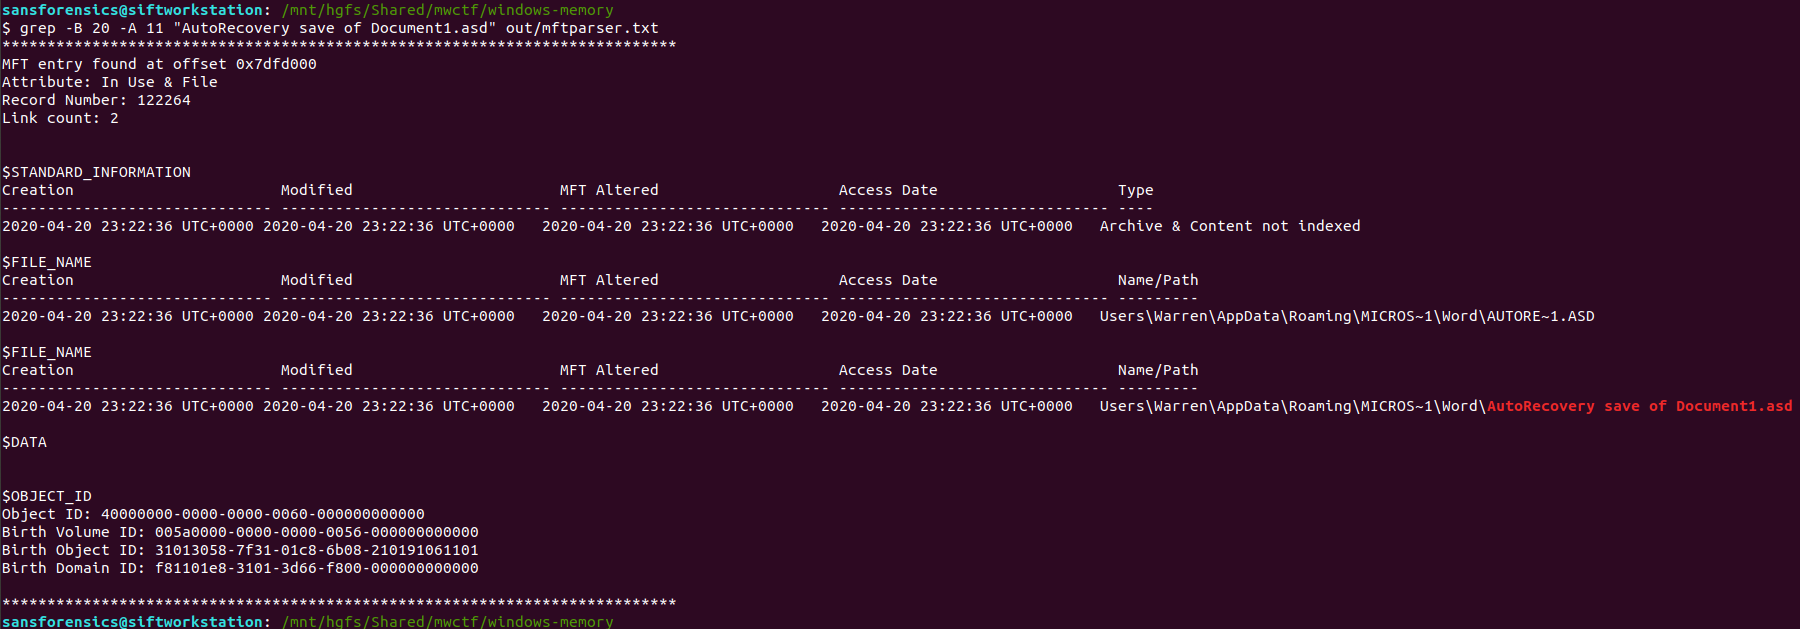
The $OBJECT_ID attribute is printed at the bottom of the entry, including the Birth Object ID value.
Flag (Part 3)
31013058-7f31-01c8-6b08-210191061101
Part 4 (20 points)
What is the name of the user and their unique identifier which you can attribute the creation of the file document to?
Format: #### (Name)
We know that the AutoRecovery document was stored in the profile for user Warren. We could dig into the registry to link each ProfileImagePath to its SID and RID values, but a big part of memory analysis is quick wins and I know that the hashdump plugin will print the username, RID, and NTLM hash for each local account on the box. Based on the format hint in the question, the RID and username are all we need for now.
vol.py -f memdump.mem --profile=Win7SP1x64 hashdump | tee /mnt/hgfs/Shared/mwctf/windows-memory/out/hashdump.txt

There we go – user account Warren has RID 1000. Not too surprising as this is the only user account other than the built-in Administrator and Guest accounts, but now we have confirmed it. The NTLM hash isn’t really of any use to us at the moment, but credentials and hashes are always nice to have around.
Flag (Part 4)
1000 (Warren)
Part 5 (25 points)
What is the version of software used to create the file containing the password?
Format ## (Whole version number, don’t worry about decimals)
Ok now we have to dig into the registry! Volatility has a printkey plugin that is smart enough to query each registry hive it finds and print all of the results, but we can be more targeted by specifying which registry hive we are interested in first. The hivelist plugin displays the virtual and physical offsets for each of the hives it is able to find. Again, this will likely be useful later on so write the output to a file.
vol.py -f memdump.mem --profile=Win7SP1x64 hivelist | tee /mnt/hgfs/Shared/mwctf/windows-memory/out/hivelist.txt

I looked in the ntuser.dat hive associated the Warren user account. This hive contains, among other useful things, data about software installed by the user. Now we have the offset for the hive, we can run the printkey plugin and pull the data relating to the Microsoft Office installation.
vol.py -f memdump.mem --profile=Win7SP1x64 printkey -o 0xfffff8a003ebd010 -K "SOFTWARE\Microsoft\Office"
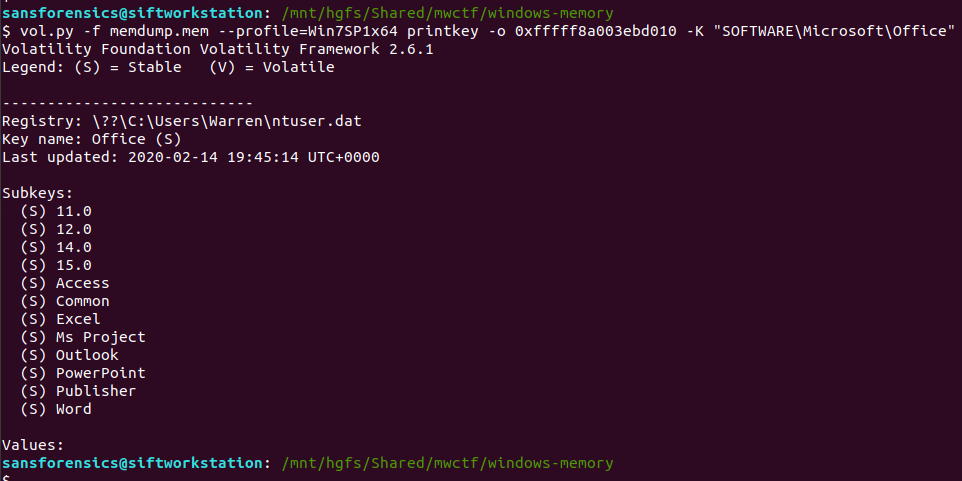
Now, I wasn’t completely sure of the answer at this point. The Subkeys 11.0, 12.0, 14.0, and 15.0 all relate to Office versions, but which one is correct? After a bit more digging I found another registry key, this time in the HKLM\Software hive, that confirmed which version was correct.
vol.py -f memdump.mem --profile=Win7SP1x64 printkey -o 0xfffff8a0002c9010 -K "Classes\Word.application\curVer"

Version 15 corresponds to Microsoft Office 2003, but thanks to the format hint we know that 15 is enough.
Flag (Part 5)
15
Part 6 (20 points)
What is the virtual memory address offset where the password string is located in the memory image?
Format: 0x########
This part caused me the most trouble. I knew how to easily find the physical offset using the strings utility and grep, but how to find the virtual offset? I recalled that Volatility has its own strings plugin, and after reading some Volatility documentation, I was able to link the physical offset to the virtual one.
Rather than outputting every string in the image, the Volatility strings plugin takes a specially formatted list of physical offsets and strings as an input, displaying the matching virtual offsets. Cool. First thing is to build the input list in the following format:
<physical offset (decimal)>:<string>
After some trial and error involving sed, awk, and cut I gave up and used the Windows Sysinternals strings64.exe utility (as suggested by the Volatility documentation!) which creates this form of output by default. Dropping back to my Windows 7 host, I dumped the strings64.exe output to my shared directory:
>strings64.exe -o memdump.mem > out/strings-physical-dec.txt
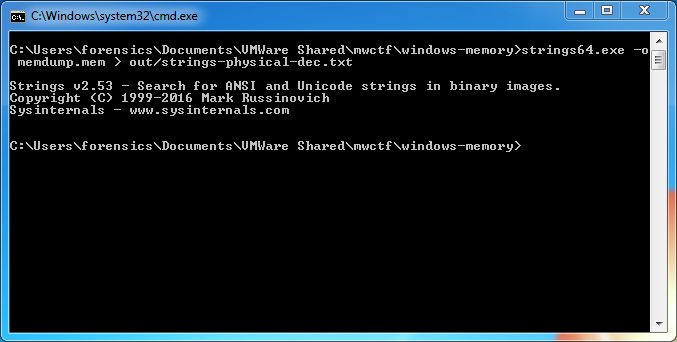
Back to SIFT and we can see that we have the required format: physical offsets in decimal representation, and the associated strings, colon-separated.
We are only really interested in the strings matching the password from Part 1, so we filter these using grep, writing the result to a file – this will be the input for the Volatility strings plugin.
head out/strings-physical-dec.txt
grep "wow_this_is_an_uncrackable_password" out/strings-physical-dec.txt | tee out/strings-physical-dec-flag1.txt

Now that the input file is formatted correctly we can throw Volatility’s own strings plugin at the image.
vol.py -f memdump.mem --profile=Win7SP1x64 strings -s out/strings-physical-dec-flag1.txt | tee out/volstrings-flag1.txt
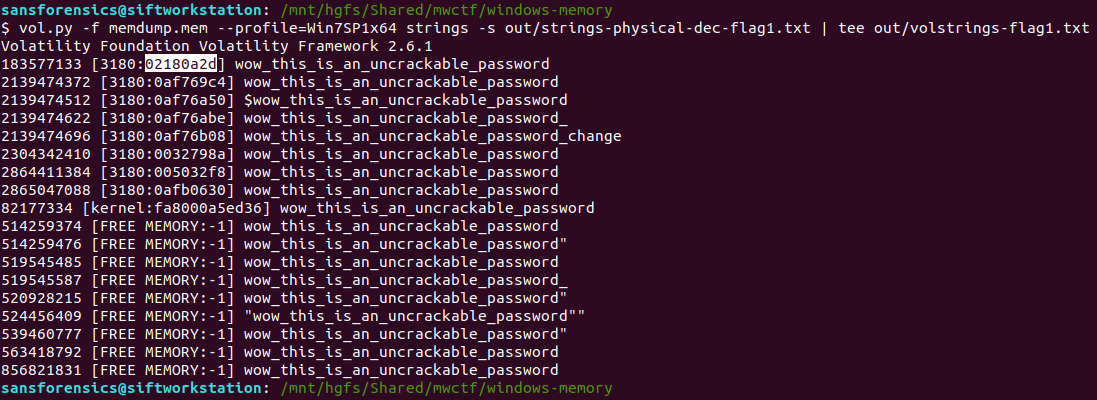
The output format is as follows:
<physical offset (decimal)> [<pid>:<virtual offset (hex)>] <string>
I wasn’t sure which of the resulting virtual offsets was the correct one so tried the first match, which was accepted.
Flag (Part 6)
0x02180a2d
Part 7 (20 points)
What is the physical memory address offset where the password string is located in the memory image?
Format: 0x########
Ok, this one was much easier. We already have the physical offset, only it is represented in decimal and the format hint specifies a hex representation. No problem though, CyberChef can fix that easily!

There we go. Solved. But just to make sure I also ran strings over the memory image from within my SIFT VM with the -t x flag to specify that offsets should be printed as hex rather than decimal. Searching for the password with grep returns a single hit, matching nicely with the value from CyberChef.
strings -t x memdump.mem > out/strings-physical-hex.txt
grep "wow_this_is_an_uncrackable_password" out/strings-physical-hex.txt

Flag (Part 7)
0xaf12a2d
Memlabs Memory Forensics Challenges – Lab 5 Write-up
Memlabs is a set of six CTF-style memory forensics challenges released in January 2020 by @_abhiramkumar and Team bi0s. I have been working on the Magnet Weekly CTF recently so the other write-ups I had in progress have been sitting partially finished for a while now. This write-up covers Lab 5 – Black Tuesday, which I worked on back in July! You can find the rest of my Memlabs write-up here.

MD5: 9dd6cb1134c9b018020bad44f27394db
SHA1: 289ec571ca6000b6234dee20c28d4cdba13e4ab7
After downloading the memory image and calculating the hashes, the first thing to do is determine which profile Volatility should use for the rest of the analysis.
vol.py -f MemoryDump_Lab5.raw imageinfo

The imageinfo plugin suggests a few profiles we can use; let’s go with Win7SP1x64 for now, and check the running processes with pstree.
vol.py -f MemoryDump_Lab5.raw --profile=Win7SP1x64 pstree
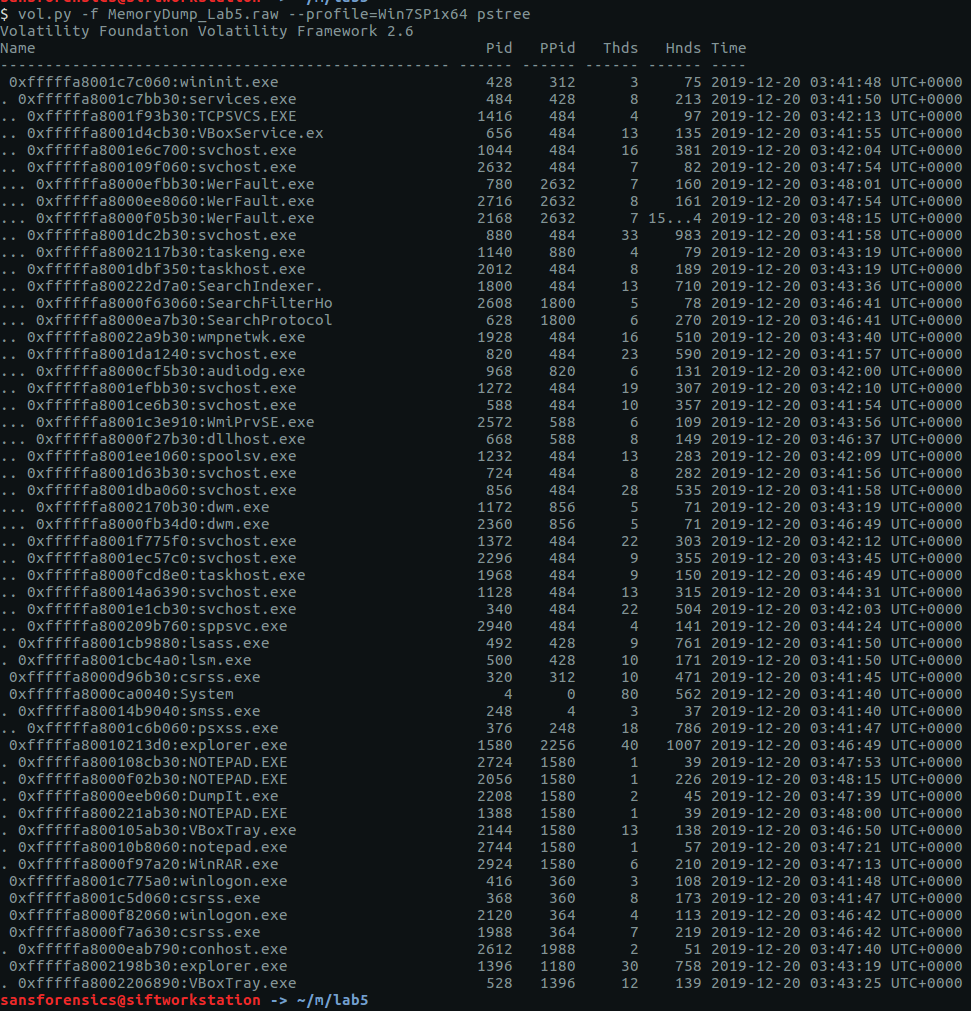
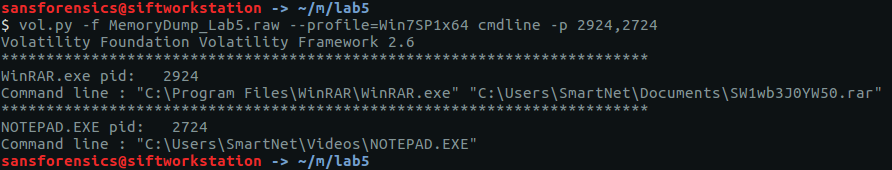
There are a few user processes that warrant investigation but no immediately obvious starting point. The cmdline plugin will display any command-line arguments that were passed when the process was started. Initially I ran the cmdline plugin with no additional arguments, but I have truncated the output to focus on two of the more interesting processes – WinRAR.exe and NOTEPAD.EXE.
vol.py -f MemoryDump_Lab5.raw --profile=Win7SP1x64 cmdline -p 2924,2724
We can see that the WinRAR process has a file associated with it; using the filescan and dumpfiles plugins we can extract this file from the memory image.
vol.py -f MemoryDump_Lab5.raw --profile=Win7SP1x64 filescan > filescan.txt
grep -E 'SW1wb3J0YW50.rar

Now we have the RAR file…
unrar e SW1wb3J0YW50.rar

…but we don’t have the password to open it. The RAR file contains Stage2.png, let’s go find the Stage 1 password.
After going down a few dead ends, I tried the screenshot plugin which, as the name suggests, allows us to see what was displayed on the desktop at the time the memory dump was taken. The screenshots are actually wire-frame drawings showing the positions and titles of the displayed windows. It won’t show us the full window content, but it is often enough to get an idea of what was displayed on the desktop.
vol.py -f MemoryDump_Lab5.raw --profile=Win7SP1x64 screenshot -D screenshot-output/
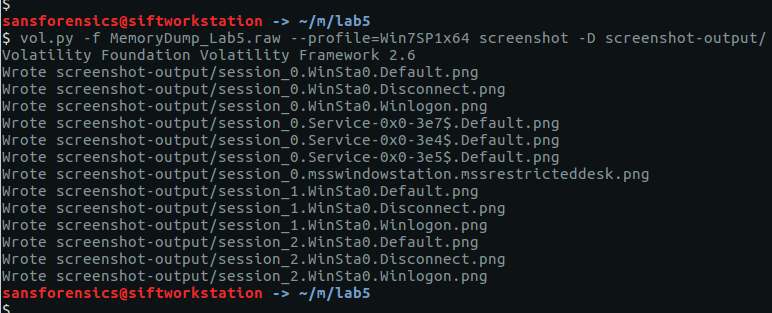
The screenshot plugin outputs a number of images; most are empty but one (session_1.WinSta0.Default.png) shows us that the Windows Photo Viewer was displaying a file with what looks to be a base64 filename:

ZmxhZ3shIV93M0xMX2QwbjNfU3Q0ZzMtMV8wZl9MNEJfM19EMG4zXyEhfQ
We can decode the base64 with CyberChef…

…and there’s our Stage 1 flag:
flag{!!_w3LL_d0n3_St4g3-1_0f_L4B_5_D0n3_!!}
Now, we can go back to the RAR file and extract the Stage2.png:

Success!
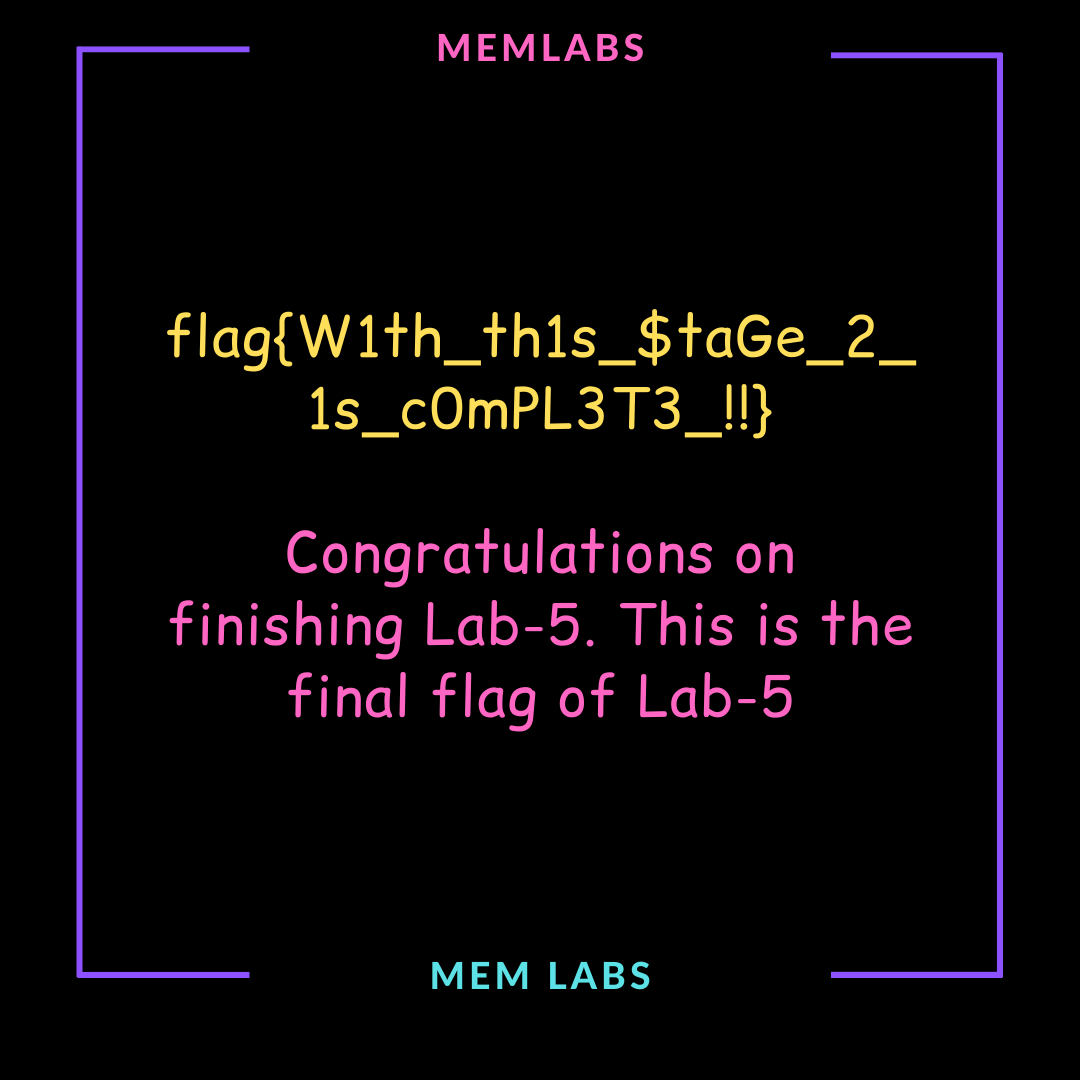
flag{W1th_th1s_$taGe_2_1s_c0mPL3T3_!!}
Between “completing” this lab in the middle of July 2020 and finding time to write it up (in November!), the challenge description has been updated with the following note:
This challenge is composed of 3 flags. If you think 2nd flag is the end, it isn’t!! 😛
What?

This kind of thing was exactly what put me off the Memlabs challenges in the first place. Maybe the NOTEPAD.EXE process (PID: 2724) is worth examining, but I’m moving on.
Memlabs Memory Forensics Challenges – Lab 4 Write-up
Memlabs is a set of six CTF-style memory forensics challenges released in January 2020 by @_abhiramkumar and Team bi0s. This write-up covers Lab 4 – Obsession. You can find the rest of my Memlabs write-ups here.

As usual I started by calculating hashes for the image…
MD5: d2bc2f671bcc9281de5f73993de04df3
SHA1: bf96e3f55a9d645cb50a0ccf3eed6c02ed37c4df
…and running the Volatility imageinfo plugin to determine which profile to use for the rest of the analysis.
vol.py -f MemoryDump_Lab4.raw imageinfo
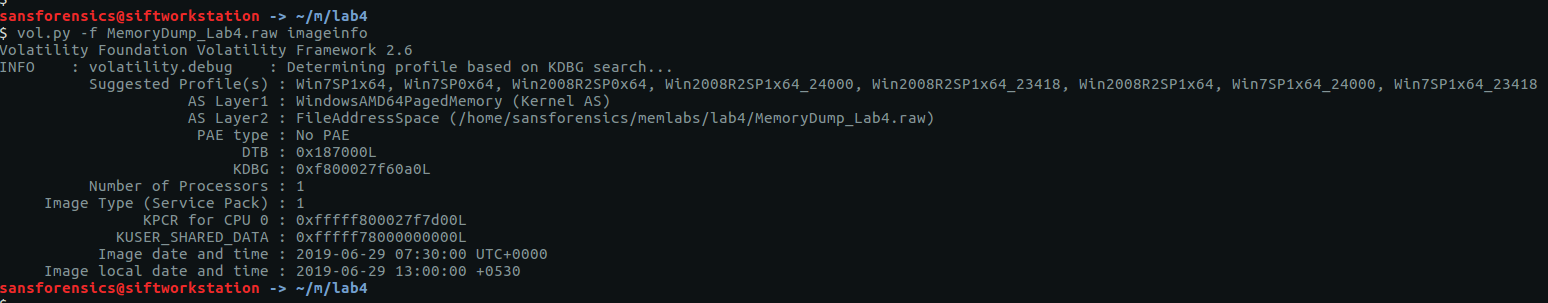
Having chosen Win7SP1x64 from the suggested profiles, I next checked the running processes with the pstree plugin.
vol.py -f MemoryDump_Lab4.raw --profile=Win7SP1x64 pstree

I briefly investigated the StikyNot.exe process but found nothing of interest. Let’s try the filescan plugin instead. I directed the output to a file, and used grep to filter the files in user profile directories, guessing that anything “very important” to the user would be stored there.
vol.py -f MemoryDump_Lab4.raw --profile=Win7SP1x64 filescan > filescan.txt
grep '\\Users\\' filescan.txt

Indeed, examining the filtered list we see a reference to Important.txt in a Desktop directory. My first approach was simply to run the dumpfiles plugin to recover the file from the memory image…
vol.py -f MemoryDump_Lab4.raw --profile=Win7SP1x64 dumpfiles -Q 0x000000003fc398d0 -D . -n
… but in this case no output was created.
We can’t extract the file directly but there is another place the data might be stored. On an NTFS partition, small files (up to a few hundred bytes) may be stored as resident in the $DATA attribute in the Master File Table (MFT). We can use the mftparser plugin to, well, parse the MFT, and use grep again to filter the relevant entry. The -C 20 argument in my grep command instructs grep to return the 20 lines above and below the matching line.
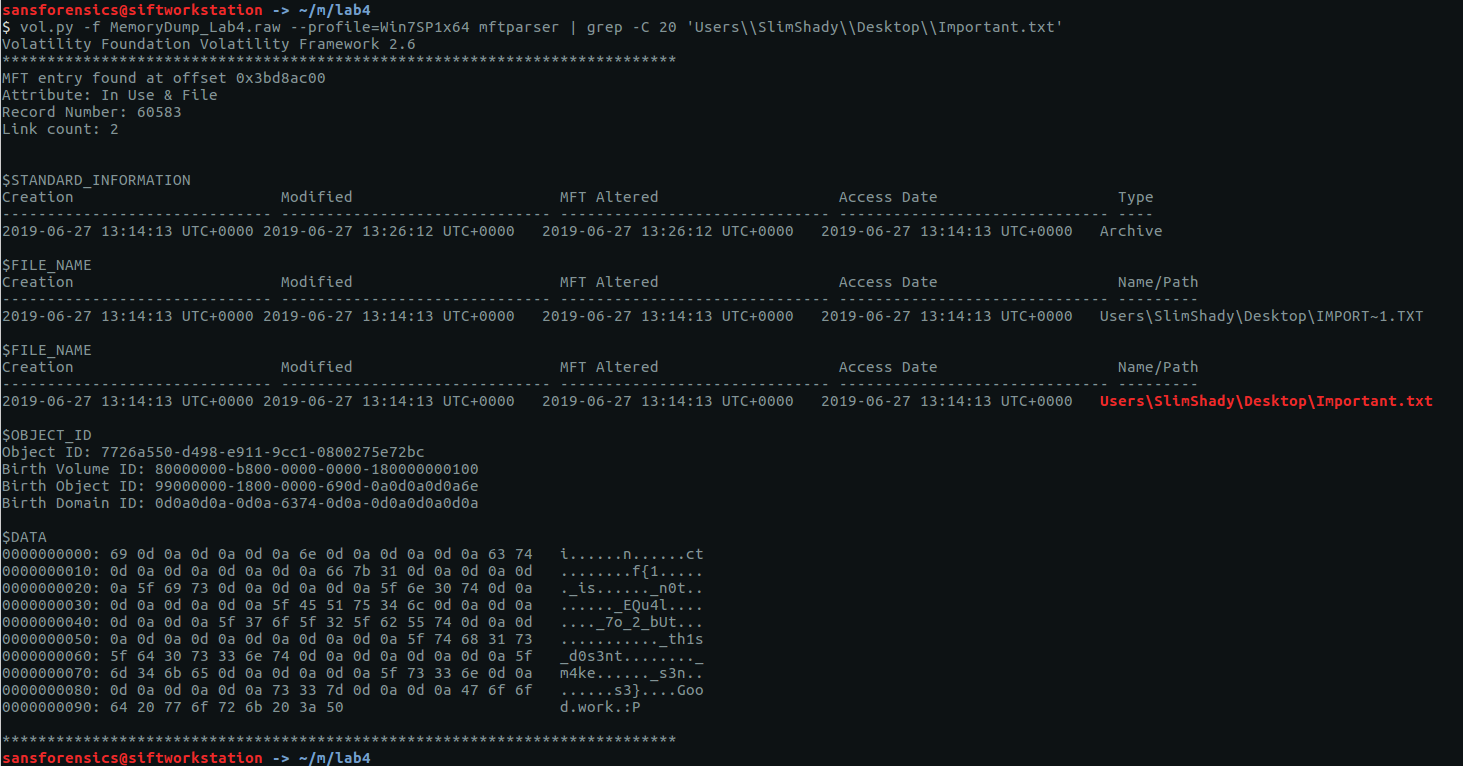
Looking at the $DATA attribute, we can see something that looks like the flag but broken up with whitespace characters; with CyberChef we can easily convert the raw bytes to text then remove these…

… leaving us with our flag to complete the challenge.
inctf{1_is_n0t_EQu4l_7o_2_bUt_th1s_d0s3nt_m4ke_s3ns3}
Memlabs Memory Forensics Challenges – Lab 3 Write-up
Memlabs is a set of six CTF-style memory forensics challenges released in January 2020 by @_abhiramkumar and Team bi0s. This write-up covers Lab 3 – The Evil’s Den. You can find the rest of my Memlabs write-ups here.

Before starting with the analysis I calculated the MD5 and SHA1 hashes of the memory dump
MD5: ce4e7adc4efbf719888d2c87256d1da3
SHA1: b70966fa50a5c5a9dc00c26c33a9096aee20f624
And determined the correct profile for Volatility:
vol.py -f MemoryDump_Lab3.raw imageinfo
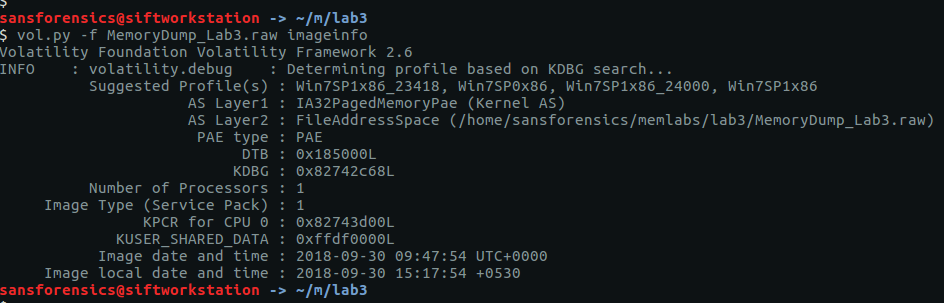
The imageinfo plugin suggests a few profiles; I used Win7SP1x86_23418 to complete the analysis. To begin with, let’s check the running processes with pstree:
vol.py -f MemoryDump_Lab3.raw --profile=Win7SP1x86_23418 pstree

There are two notepad.exe processes running (Pid: 3736 & 3432) but nothing else that immediately jumps out. Using the cmdlines plugin we may be able to see which files were opened.
vol.py -f MemoryDump_Lab3.raw --profile=Win7SP1x86_23418 cmdline -p 3736,3432

That’s a bit more interesting now! Notepad was used to open two files – evilscript.py and vip.txt – let’s try to extract them:
vol.py -f MemoryDump_Lab3.raw --profile=Win7SP1x86_23418 filescan > filescan.txt
grep -E '\\Desktop\\evilscript.py|\\Desktop\\vip.txt' filescan.txt
vol.py -f MemoryDump_Lab3.raw --profile=Win7SP1x86_23418 dumpfiles -Q 0x000000003de1b5f0 -D . -n
vol.py -f MemoryDump_Lab3.raw --profile=Win7SP1x86_23418 dumpfiles -Q 0x000000003e727e50 -D . -n

I used the filescan plugin to list all of the file objects (and their offsets) within the memory image, and redirected the output to a file. Using grep we get the offsets for the files (and also notice that evilscript.py is actually evilscript.py.py), then the dumpfiles plugin will extract the files to disk for analysis.
evilscript.py
import sys
import string

def xor(s):
  a = ''.join(chr(ord(i)^3) for i in s)
  return a

def encoder(x):
  return x.encode("base64")

if __name__ == "__main__":
  f = open("C:\\Users\\hello\\Desktop\\vip.txt", "w")
  arr = sys.argv[1]
  arr = encoder(xor(arr))
  f.write(arr)
  f.close()
vip.txt
am1gd2V4M20wXGs3b2U=
So, we have a Python script that works as follows:
- Take a string as a command-line argument
- Break that string down to its individual characters, and XOR each character with 3
- Encode the XOR’d string as Base64
- Write the Base64 encoded string to the file vip.txt
We could write another Python script to reverse these steps, but CyberChef is much easier!
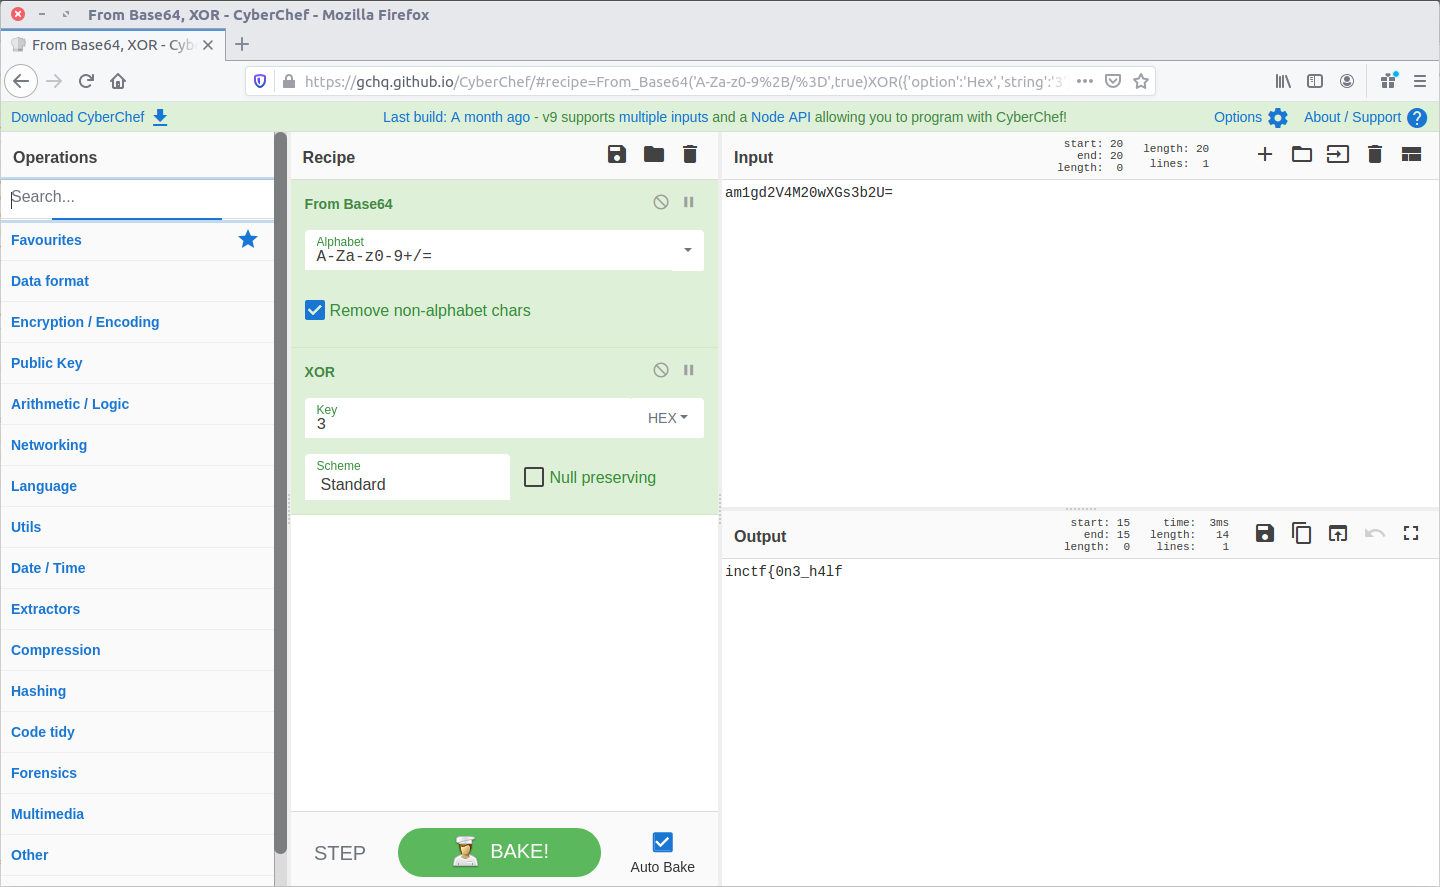
Reversing the steps from evilscript.py, CyberChef spits out the first part of our flag:
inctf{0n3_h4lf
Now we have the first part of the flag, but we still need to find the second. None of the other running processes look particularly interesting, but the challenge description specifically mentions that steghide is required.
Steghide is a steganography program that is able to hide data in various kinds of image and audio files.

Using grep and my saved filescan output I filtered for common image file extensions, and spotted the following after searching for JPEG files:
grep -E '.jpg$|.jpeg

After extracting suspision1.jpeg:

We can feed it into steghide to check for any hidden data. Presumably the first part of the flag is the password…
steghide extract -sf suspision1.jpeg
cat secret\ text

And there we go, the second part of our flag.
_1s_n0t_3n0ugh}
Put them together, and we have completed the challenge!
inctf{0n3_h4lf_1s_n0t_3n0ugh}
Memlabs Memory Forensics Challenges – Lab 2 Write-up
Memlabs is a set of six CTF-style memory forensics challenges released in January 2020 by @_abhiramkumar and Team bi0s. I completed and published my write-up of Lab 1 in February 2020, but skipped the rest of the challenges due to the general wild-goose-chase approach of simply running Volatility plugins and searching the output for interesting strings.
That was until I saw Jessica Hyde mention the Memlabs challenges on Twitter during the SANS DFIR Summit, and noticed that they had been updated to include some context about why the analysis was needed. With my main complaint from Lab 1 taken care of I jumped back in, starting with Lab 2 – A New World.

As usual, I started by confirming the MD5 and SHA1 hashes of the memory image…
MD5: ddb337936a75153822baed718851716b
SHA1: 3ee71b2507e6b5b15bb2e5f97bf809ef7c85d810
And by determining the correct profile for Volatility using the imageinfo plugin:
vol.py -f MemoryDump_Lab2.raw imageinfo
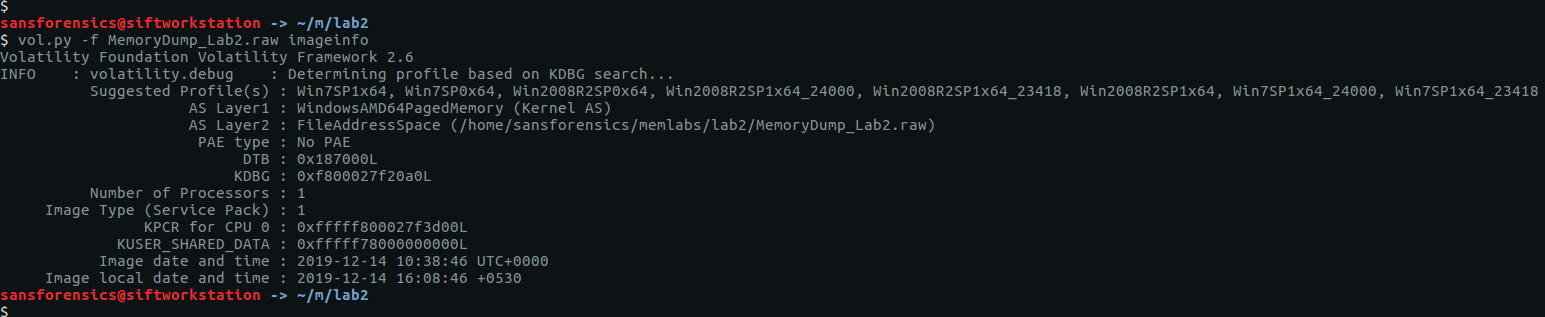
The output gives us a number of suggestions; Win7SP1x64 will do for now.
The challenge contains three flags, but the order is not important. I am presenting this write-up in the order that I found the flags – Stage 3, Stage 2, then Stage 1.
Stage 3
The challenge description mentions that web browsers and password managers. Checking the running processes with the pstree plugin shows that Chrome and the KeePass password manager were running when the dump was made. Let’s start with Chrome.
vol.py -f MemoryDump_Lab2.raw --profile=Win7SP1x64 pstree

The filescan plugin will produce a list of all of the file objects within the memory dump; it can take some time to run so I redirected the output to a file to speed up grep searches later on.
vol.py -f MemoryDump_Lab2.raw --profile=Win7SP1x64 filescan > filescan.txt
head filescan.txt

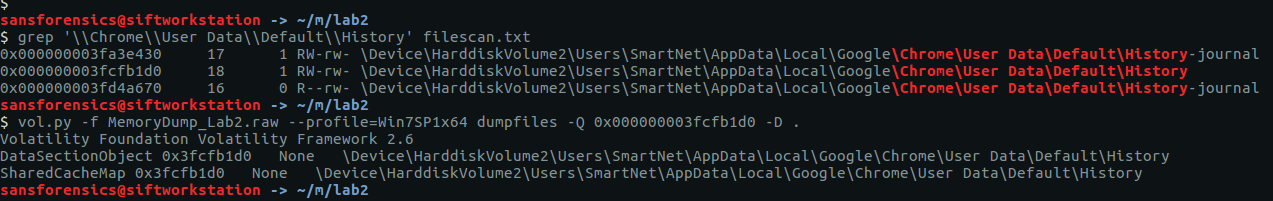
Using grep to search for the location of the Chrome History file we can find and extract the database for analysis using the dumpfiles plugin.
grep '\\Chrome\\User Data\\Default\\History' filescan.txt
vol.py -f MemoryDump_Lab2.raw --profile=Win7SP1x64 dumpfiles -Q 0x000000003fcfb1d0 -D .
The History file is a SQLite database which we can explore with the sqlite3 command-line tool, or with a GUI application such as DB Browser for SQLite.

Browsing the database we see that the MEGA file-sharing website was visited; let’s check that out.

The directory title – MemLab_Lab2_Stage3 – is promising but the ZIP file is password protected.

Fortunately we already know the flags from Lab 1, and CyberChef can easily calculate the SHA1 hash:
6045dd90029719a039fd2d2ebcca718439dd100a
The password is accepted and Important.png is extracted, giving us our first flag (actually for Stage 3, but nevermind).
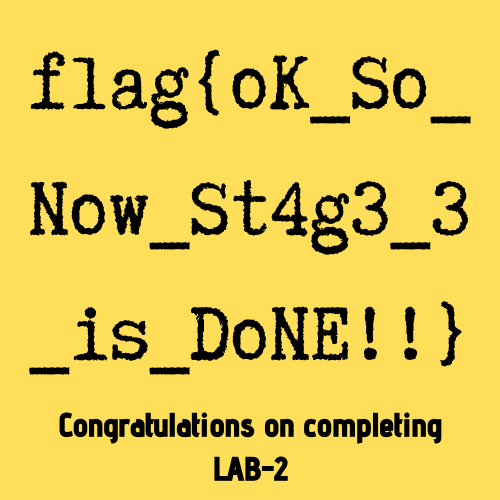
flag{oK_So_Now_St4g3_3_is_DoNE!!}
Stage 2
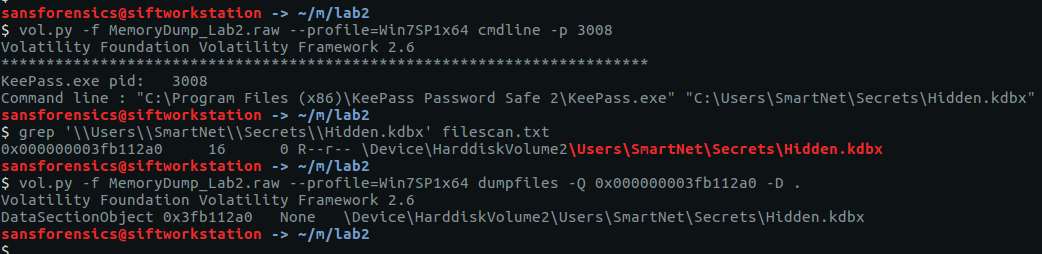
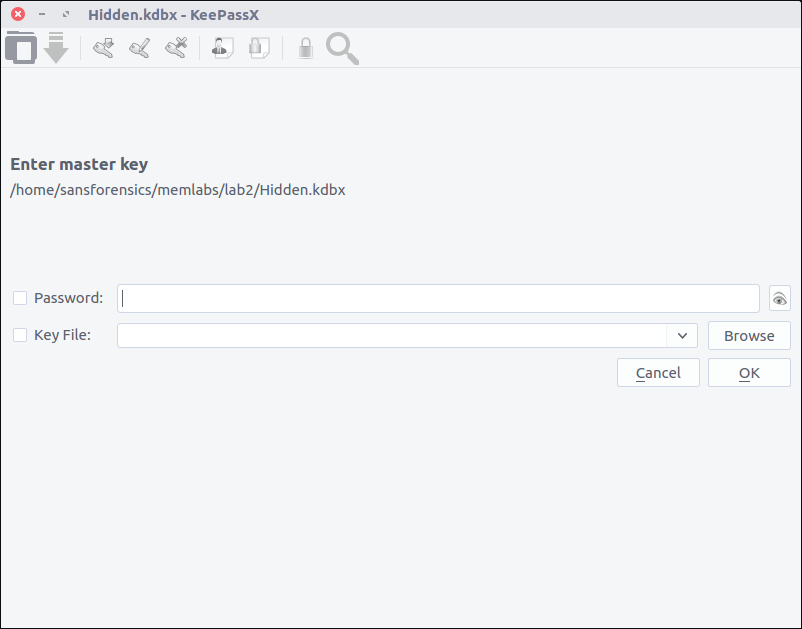
We have investigated the browser history, now let’s take a look at KeePass. We know the KeePass Process ID (3008) from the pstree output earlier. By checking the command-line associated with the KeePass process using the cmdline plugin we can find the location of the KeePass database file, then extract it from the memory dump in the same way as the Chrome History file.
vol.py -f MemoryDump_Lab2.raw --profile=Win7SP1x64 cmdline -p 3008
grep '\\Users\\SmartNet\\Secrets\\Hidden.kdbx' filescan.txt
vol.py -f MemoryDump_Lab2.raw --profile=Win7SP1x64 dumpfiles -Q 0x000000003fb112a0 -D .
After installing KeePassX on my SIFT VM, I can open the file but require a password before I can actually view any of the contents.
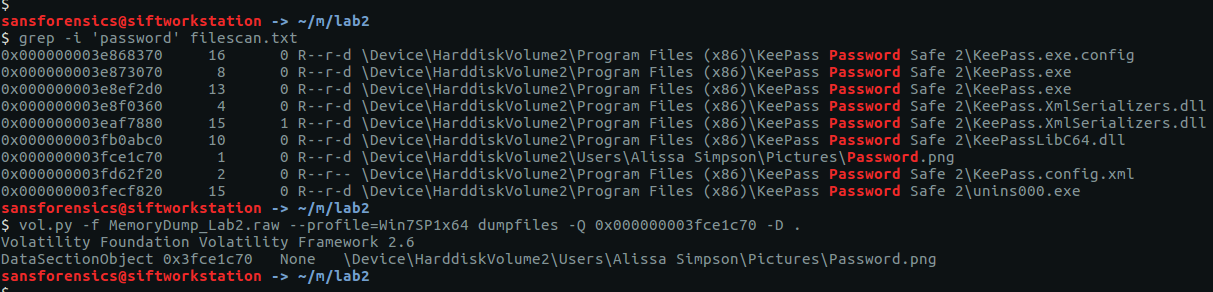
I got lucky with grep searches over the saved filescan output from earlier and was able to extract a file named Password.png
grep -i 'password' filescan.txt
vol.py -f MemoryDump_Lab2.raw --profile=Win7SP1x64 dumpfiles -Q 0x000000003fce1c70 -D .
Opening the extracted PNG file, we see the following:
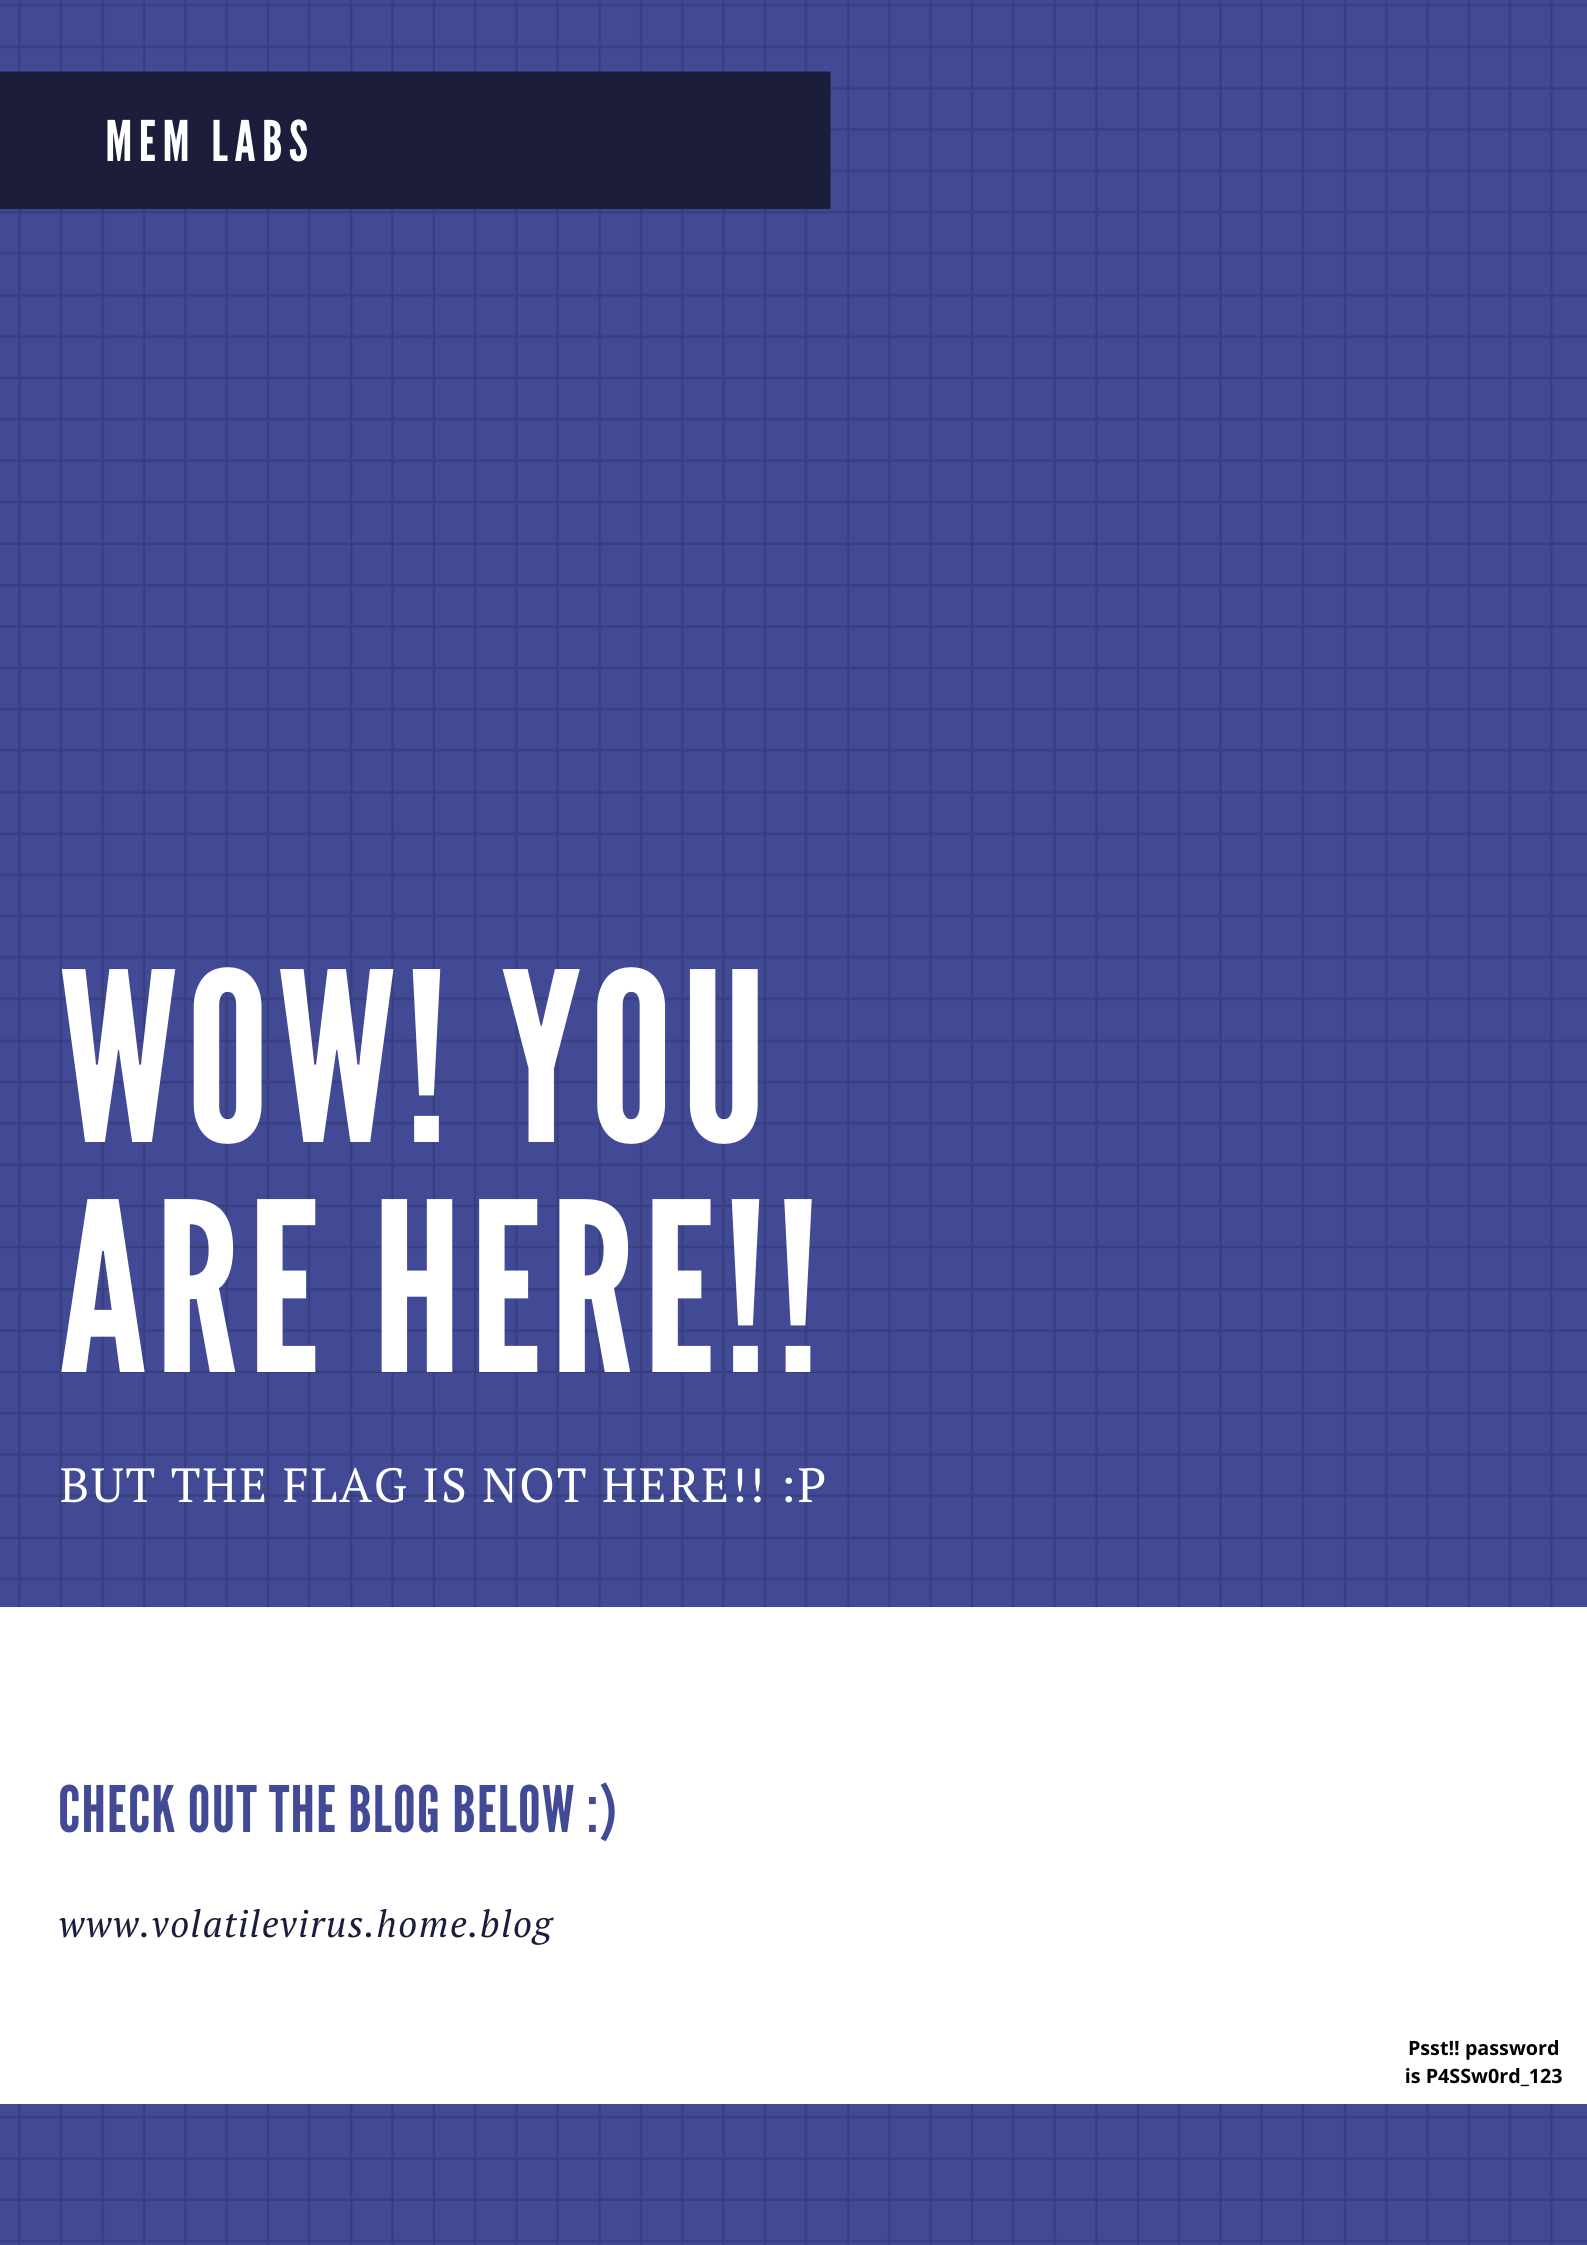
The lower right-hand corner of the image contains the following text:
Psst!! password is P4SSw0rd_123
After entering the newly acquired password into KeePassX, we can browse the stored credentials and find the flag for Stage 2.

flag{w0w_th1s_1s_Th3_SeC0nD_ST4g3_!!}
Stage 1
While working on Stage 2 I ran the cmdscan plugin along with cmdline. The cmdscan plugin didn’t return anything related to KeePass, but it did show some unusual output from a cmd.exe shell.
vol.py -f MemoryDump_Lab2.raw --profile=Win7SP1x64 cmdscan

The challenge description emphasises that the owner of the system is an environmental activist; pulling out the environment variables for this process (2068) with the envvars plugin gives us the following:
vol.py -f MemoryDump_Lab2.raw --profile=Win7SP1x64 envars -p 2068

The environment variable NEW_TMP contains what appears to be a base64 string:
ZmxhZ3t3M2xjMG0zX1QwXyRUNGczXyFfT2ZfTDRCXzJ9
Going back to CyberChef, we can decode this with ease and return our final flag for Lab 2.

flag{w3lc0m3_T0_$T4g3_!_Of_L4B_2}
